What are the names of the default widgets displayed on the System Dashboard and what information do they display?
The System Dashboard of the Crystal Eye displays 10 default widgets. These widgets are discussed in detail below.
1. Network LAN Interface Report Widget
The Network LAN Interface Report Widget gives a glimpse of the data received and transmitted (Mbps) over all LAN interfaces (including wifi interface) of the CE network. The information in this widget is depicted through a graph. The data displayed in the graph can be adjusted according to a particular time window such as last week, last 3 hours, last 12 hours, last 24 hours, lat 3 days, last week, last month, last 3 months etc.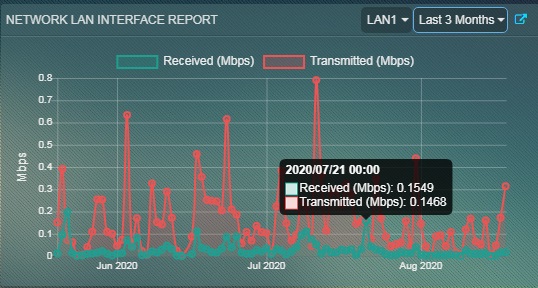
| Associated Links—Network LAN Interface Report Widget |
|---|
| CE Manual - Network LAN Interface Report Widget |
| CE Manual - Network Interfaces Application |
| Crystal Eye Dashboard Knowledge Base |
| Forum Post - CE System Dashboard - Network LAN Interface Reports |
2. Network External Interface Report Widget
The Network External Interface Report Widget gives us a glimpse of the data received and transmitted (Mbps) over all WAN interfaces of the CE network. The information in this widget is depicted through a graph. The data displayed in the graph can be adjusted according to a particular time window such as last week, last 3 hours, last 12 hours, last 24 hours, lat 3 days, last week, last month, last 3 months etc.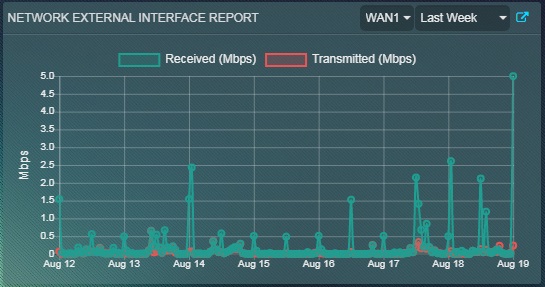
| Associated Links—Network External Interface Report Widget |
|---|
| CE Manual - Network Interface Report Widget |
| CE Manual - Network Interfaces Application |
| Crystal Eye Dashboard Knowledge Base |
| Forum Post - CE Systems Dashboard - Network External Interface Report Widget |
3. Process CPU Usage Widget
The Process CPU Usage widget does a good job providing vital information related to the extent of CPU usage by various Crystal Eye applications. It not only gives a glimpse of the CPU Usage over a period of time but also provides real-time information about the extent of CE apps utilizing Crystal Eye’s CPU. 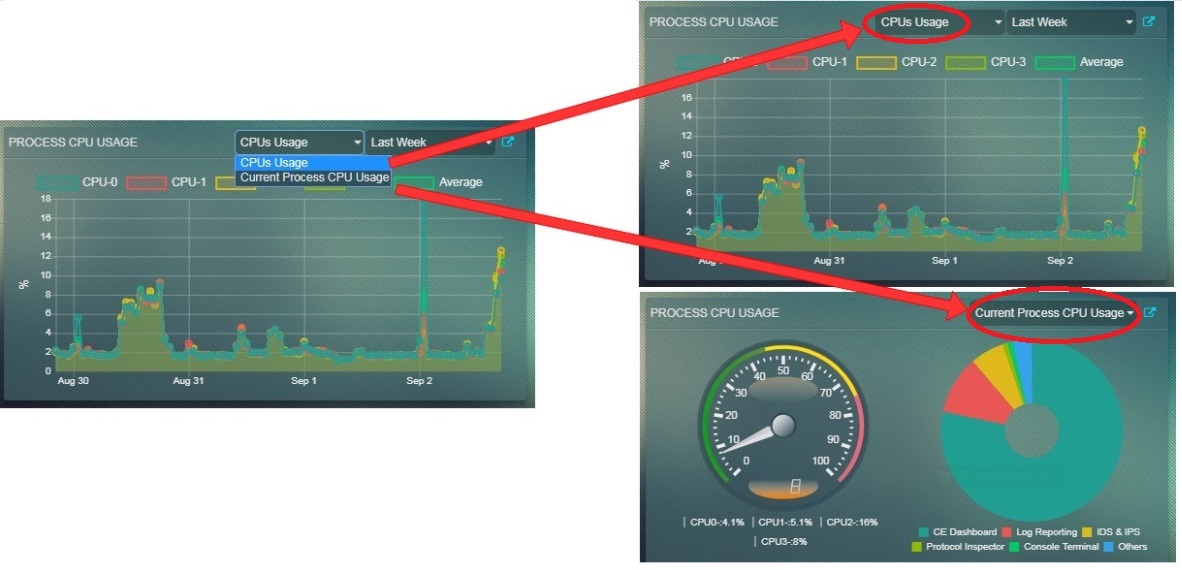
| Associated Links—Process CPU Usage Widget |
|---|
| CE Manual - Process CPU Usage Widget |
| Crystal Eye Dashboard Knowledge Base |
| Forum Post - CE System Dashboard - Process CPU Usage Widget |
4. Process Memory Usage Widget
The Process Memory Usage Widget gives the user information of the memory usage of the Crystal Eye appliance. This widget not only provides the memory usage information from the past but also displays real-time memory usage details. The information shared here goes to the extent of shedding light on the extent of memory utilized by various CE applications.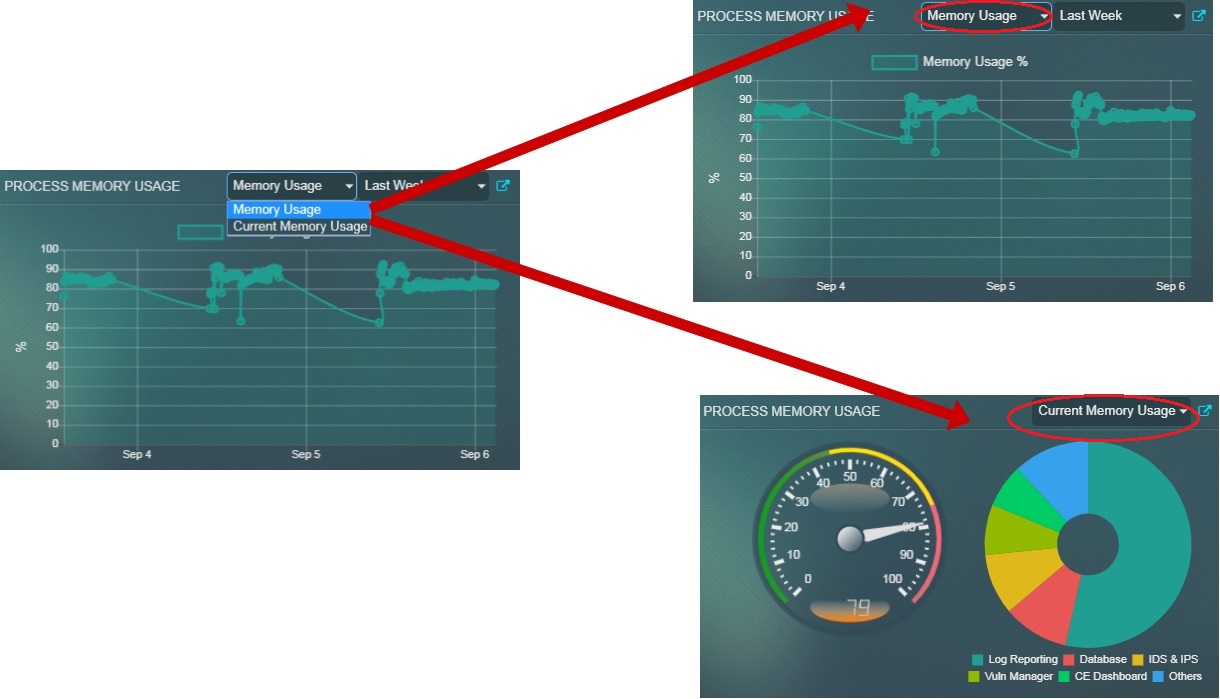
| Associated Links—Process Memory Usage Widget |
|---|
| CE Manual - Process Memory Usage Widget |
| Crystal Eye Dashboard Knowledge Base |
| Forum Post - CE System Dashboard - Process Memory Usage Widget |
5. Apps Status Widget
The App Status Widget can be monitored to get real-time information about whether some major apps of CE are working. The user can easily know the running status of 7 main services of the Crystal EYe appliance. These applications that are featured here on this widget are Content Filter, Web Proxy Server, Antivirus, Intrusion Protection & Detection, Log Processing and Reporting, Forcefield, and Incident and Event Services (SIEM).
| Associated Links—Apps Status Widget |
|---|
| CE Manual - App Status Widget https://manual.redpiranha.net/dashboard/system-dashboard#app-status |
| CE Manual - App Status Report |
| Crsytal Eye Dashboard Knowledge Base |
| Forum Post - CE System Dashboard - Apps Status Widget |
6. Events – 24 Hours Widget
The Event Logs widget provides real-time information about various types of system events occurred in the Crystal Eye network over the past 24 hours. The widget has a dedicated overview section that displays all CE events and categorizes it as Informational Events, Warning Events and Critical Events. The Notifications section displays an elaborative format of the event specifying the event type and the IP address associated with the event.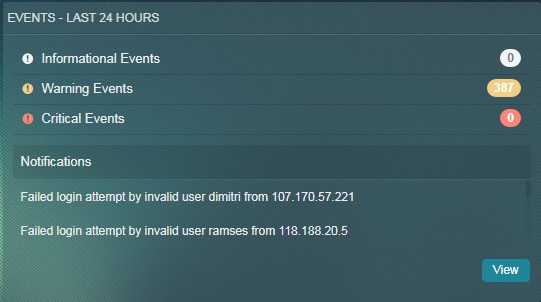
7. Shutdown/Restart Widget
The Shutdown/Restart widget provides administrators to shutdown or restart the Crystal Eye appliance from the graphic user interface. 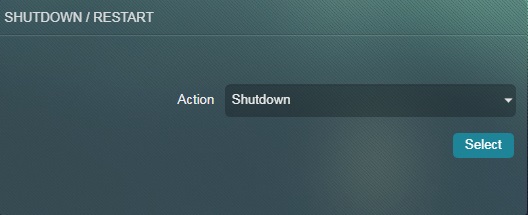
| Associated Links—Shutdown/Restart Widget |
|---|
| CE Manual - Shutdown/Restart Widget |
| Crystal Eye Dashboard Knowledge Base |
| Forum Post - CE System Dasboard - Shutdown/Restart Widget |
8. Users & Groups Widget
The Users & Groups Widget can be monitored to know the number of users and groups. This widget also has a shortcut button (Add User & Create Group) which redirects to the app where users and groups can be created.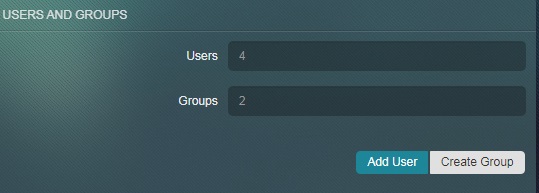
9. Disk Usage Widget
The Disk Usage widget in the System Dashboard is a great monitoring tool which sheds light on the extent to which the internal disk of the CE is used. The diagram in the widget provides information about the extent to which various CE directories are occupied with data.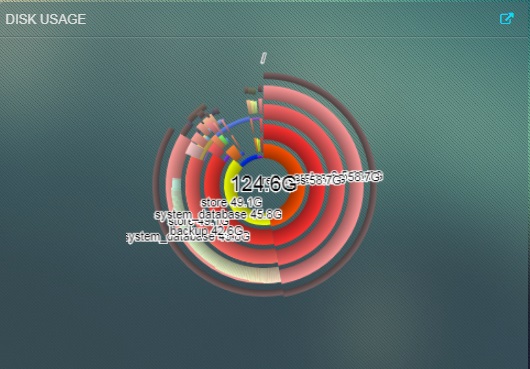
| Associated Links—Disk Usage Widget |
|---|
| CE Manual - Disk Usage Widget |
| CE Manual - Disk Usage Report |
| Crystal Eye Dashboard Knowledge Base |
| Forum Post - CE System Dashboard - Disk Usage Widget |
10. Recent Software Activity Widget
Teams here at Red Piranha are constantly working towards improving the applications of Crystal Eye. Details of all the updates pushed to the apps through Red Piranha’s service distribution network (SDN) can be viewed in the Recent Software Activity widget. This widget also displays information related to the application installation with the date and time of the installed. 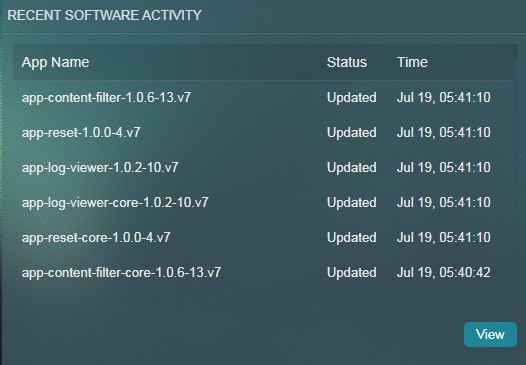
| Associated Links—Recent Software Activity Widget |
|---|
| CE Manual - Recent Software Activity Widget |
| CE Manual - Software Updates Application |
| Crystal Eye Dashboard Knowledge Base |
| Forum Post - CE System Dashboard - Recent Software Activity Widget |