Network Interfaces
The Network Interfaces application provides a comprehensive view of the various interfaces in the Crystal Eye network. The number of LAN and WAN interfaces supported by a Crystal Eye appliance varies from model to model. This application provides a detailed view of the data transmitted and received (in Mbps) over various network interfaces of the Crystal Eye appliance. The detailed view consists of graphical and tabular representation of the data transmitted over the network. With the help of user-centric reporting features of this application, the administrator can download PDF reports as well.
Note: The graph representation of the data transmitted and received via LAN1 interface & WAN1 interface can also be viewed in the System Dashboard. Click here to know how you can view and interpret the data in Network Interface Widgets in the System Dashboard.
The Network Interfaces application is installed by default and can be accessed from the left-hand navigation panel.
The Network Interfaces application page can be accessed through Left-hand Navigation Menu and the System Dashboard of the Crystal Eye appliance:
1.Access the Network Interface application through left-hand Navigation Menu:
Left-hand Navigation Menu > Reports > Network Interfaces
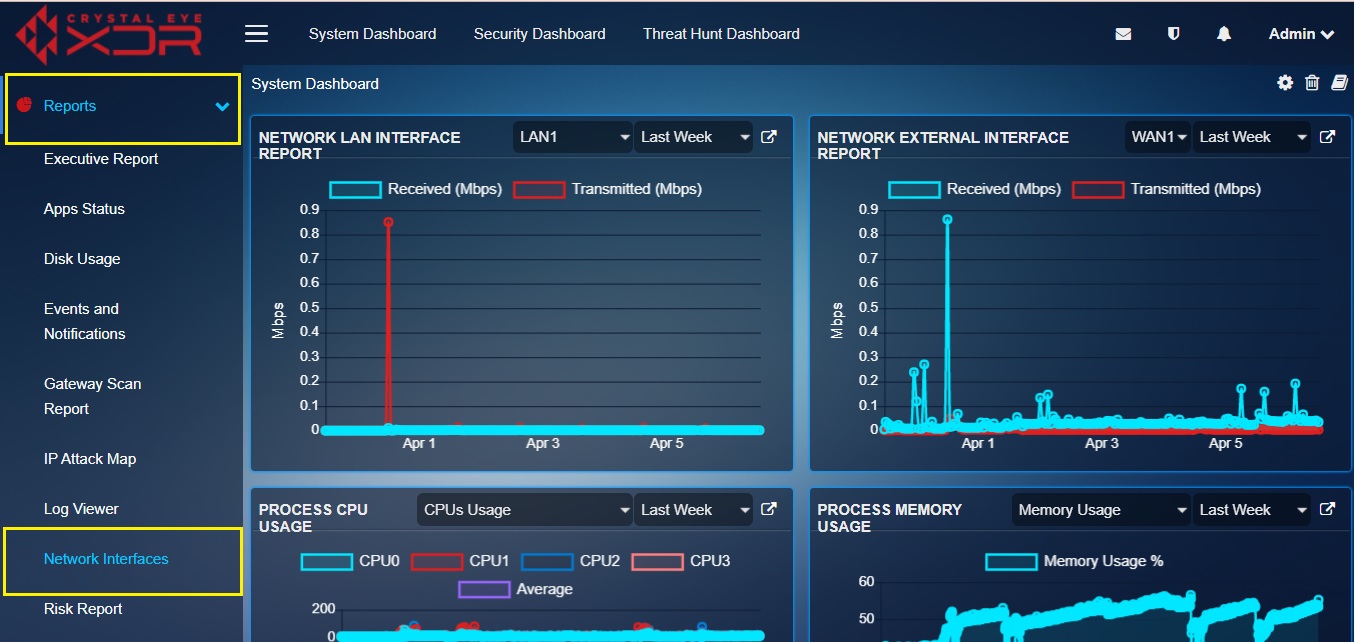
2. Access the Network Interface application through the System Dashboard:
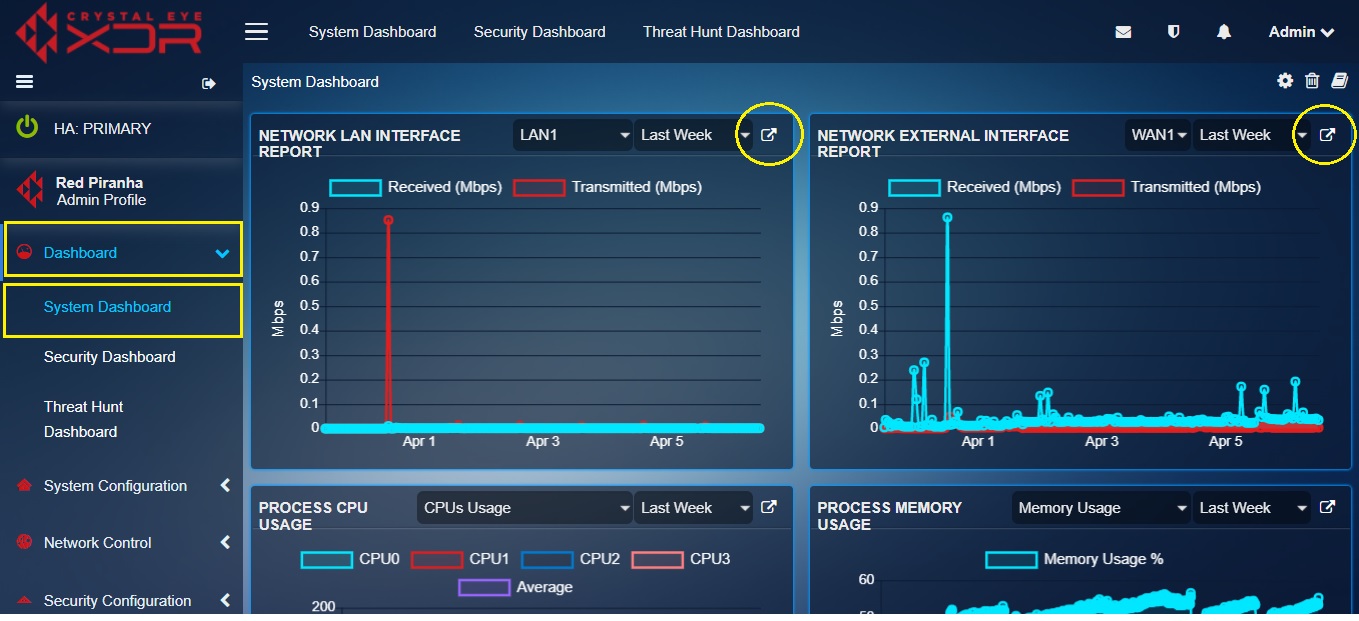
Click the Network Interface application link icon (refer to the circled icons in the screenshot below) on the top right corner of the Network LAN Interface Report (LAN1) widget and the Network External Interface Report (WAN1) widget.
The Network Interfaces application has excellent features that can be used to view and export reports in PDF format.All these reports provide insights on the amount of data transferred and received through various CE network interfaces at a specific period of time.CE administrators can also define the time period for which the report is required through the Date Range dropdown.Thus by zeroing down to a particular time period range the report can be used to point out irregularities in the CE network. By default, Network Interfaces application is designed to show the graphs and reports of all the interfaces. However, if there is a requirement to focus on a particular network interface the details regarding that can be filtered as well from the Reports section.
Note: By default, the Network Interfaces application provides an overview of all the interfaces connected to the Crystal Eye network. However, the user can seek out and filter this to view the data transmitted and received over a particular interface at a particular time period.
The Screenshot Below Shows the Network Interface Report of LAN1:
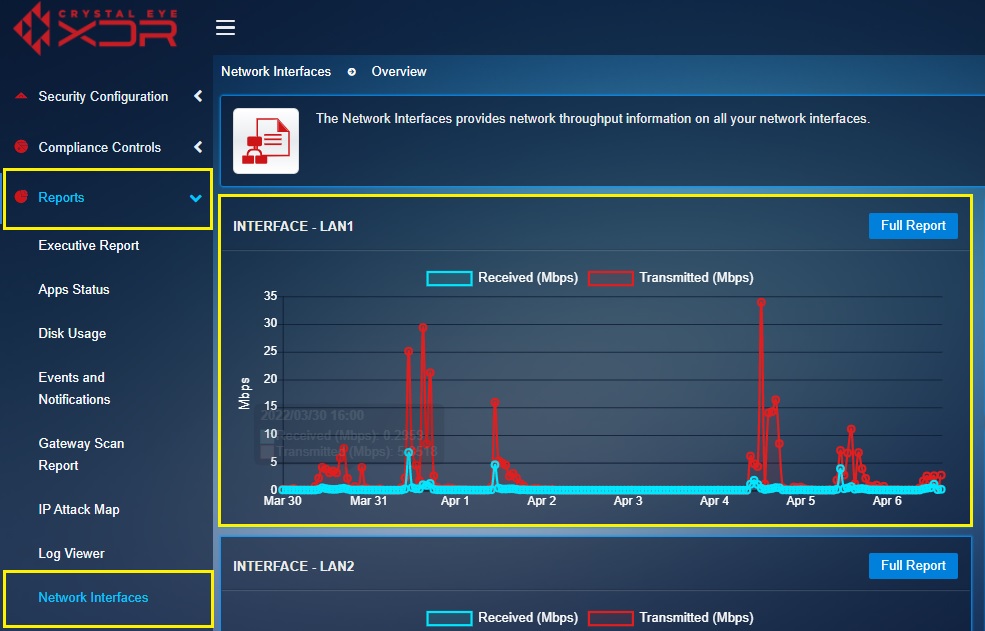
Note: In the above highlighted graphical representation of the network interface reports widget of LAN1, y-axis shows the amount of data transmitted and received in Mbps and x-axis shows the time period.
How to View & Export a PDF Report Containing Details Regarding Data Transmitted and Received on WAN, LAN and Wi-Fi Interfaces at a Given Point of Time?
Step 1: In the Network Interfaces application page, select the time period for which the transmitted and received data details is required from the Date Range dropdown under the Filter section.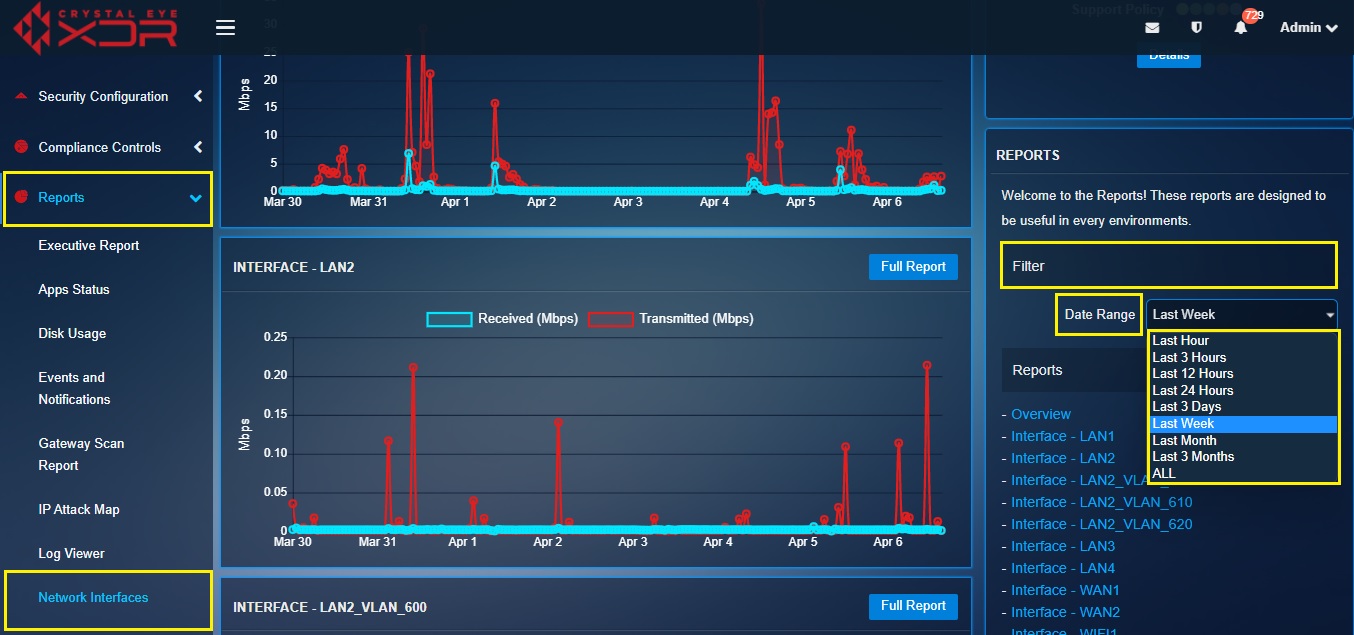
Note: The data can be filtered for various time windows such as Last Hour, Last 3 Hours, Last 12 Hours, Last 24 Hours, Last 3 Days, Last Week, Last Month, Last 3 Months and ALL.
Step 2: Click the Full Report button of the Interface for which the report is required (in this case we intend to view the full report of LAN 1 interface).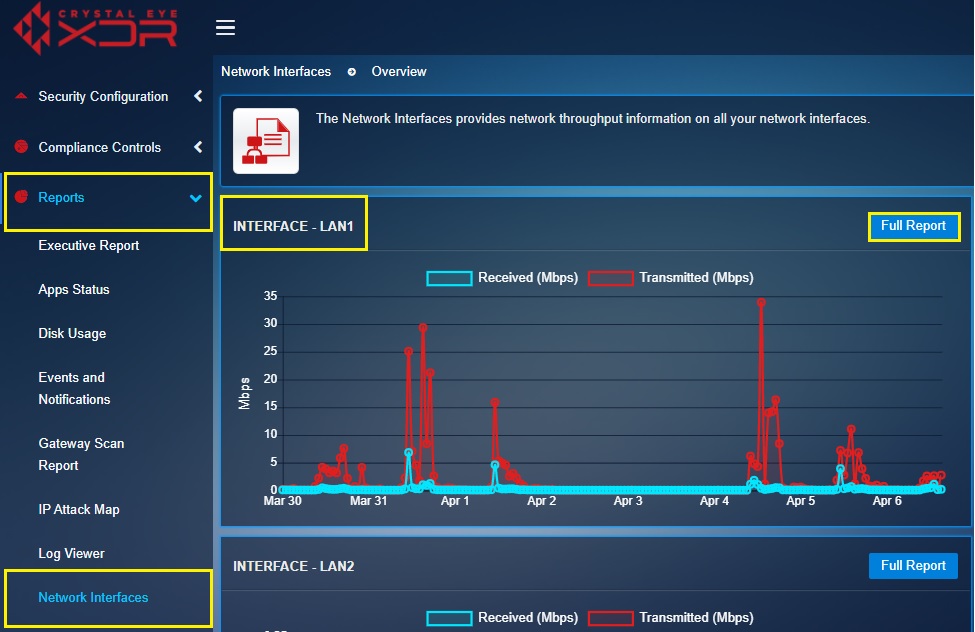
Note: You will see a graph representation of details regarding data transmitted and received on WAN, LAN, & Wi-Fi interface on this page.
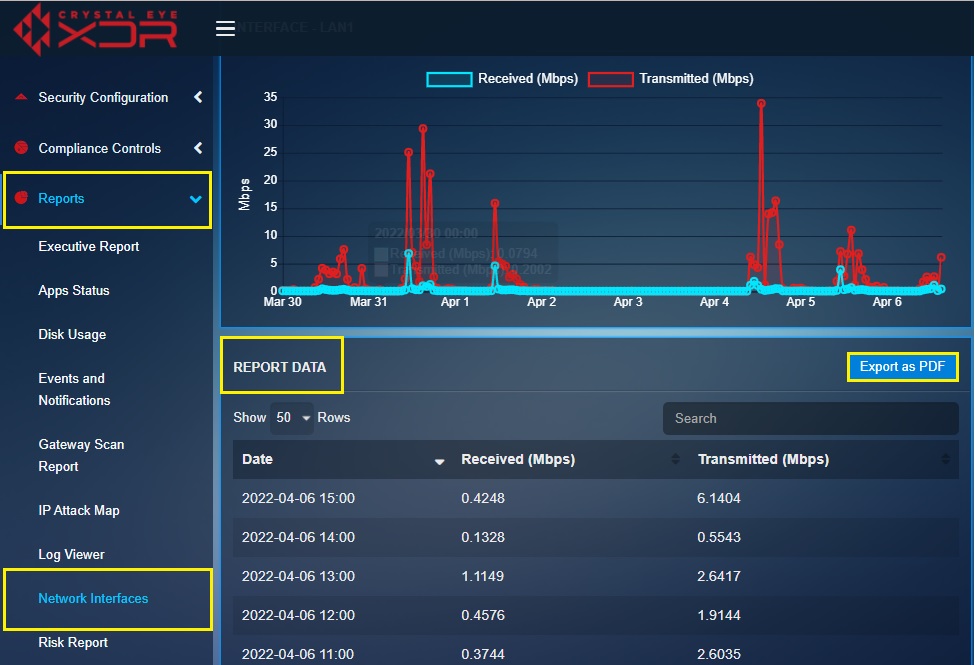
Step 3: You will now see the Full Report page of the LAN 1 interface. The Full Report consists of a dedicated page containing the graphical and tabular representation of the data transmitted and received over the WAN 1 interface.
Step 4: Click the Export as PDF button in the Report Data section to download a PDF Report containing details regarding data transmitted and received over a selected network interface.