System Dashboard
The System Dashboard enables administrators to manage various configuration settings and monitor different aspects related to the Crystal Eye XDR on-premise. It provides an overview of various applications and displays graphs that can be analysed. There are 10 widgets in the System Dashboard and each widget is linked to the application from where it draws the data. The dashboard contains an array of widgets that are shortcuts to access the related applications. The user-centric interface design allows administrators to easily monitor various aspects related to the Crystal Eye XDR on-premise on a real-time basis. It also provides an overview level data that makes monitoring hassle-free and reduces the administrative burden from a user's perspective.
The following are the widgets that can be found in the System Dashboard:
- Network Interface Reports (Includes LAN, WAN, and Wifi interfaces)
- Process CPU Usage
- Process Memory Usage
- Apps Status
- Event Logs – Last 24 Hours
- Shutdown/Restart
- Users & Groups
- Disk Usage
- Recent Software Activity
The Network Interface Report gives users insights of the data received and transmitted in LAN, WAN and Wifi interfaces of the Crystal Eye XDR on-premise network. These graphical reports are displayed in a widget format in the System Dashboard. Users can select the desired reporting period ranging from the last hour to the last 3 months to fetch data pertaining to a particular time period. These reports provide graphical information of the amount of data received and transmitted across all LAN, WAN and Wifi interfaces at a given period of time in two different widgets.
The Screenshot Below Shows the Network Interface Report Graph:
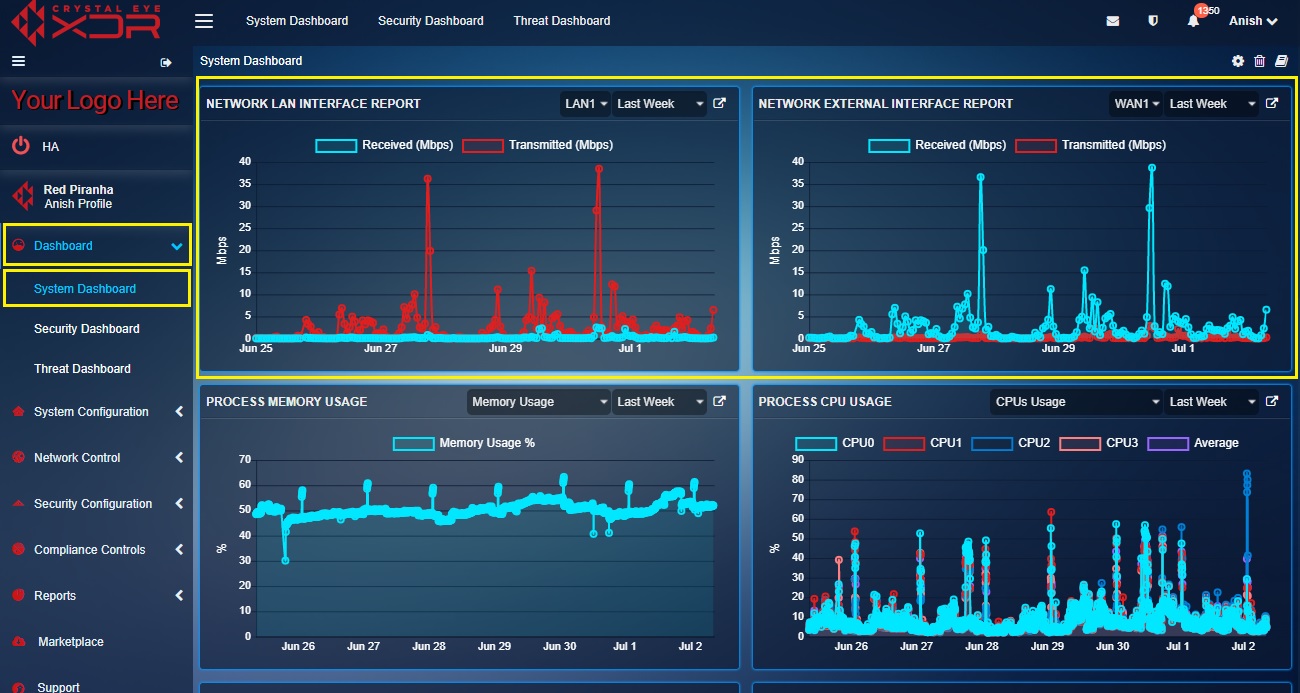
Note: In the above highlighted graphical representation of the network interface report, y-axis shows the amount of data transmitted and received in Mbps and x-axis shows the time period.
How to Interpret the Graph Data in the Network Interface Reports Widget?
Step 1: In the LAN & WAN interface report widget, select the time window for which the data is required from the Time Period dropdown.
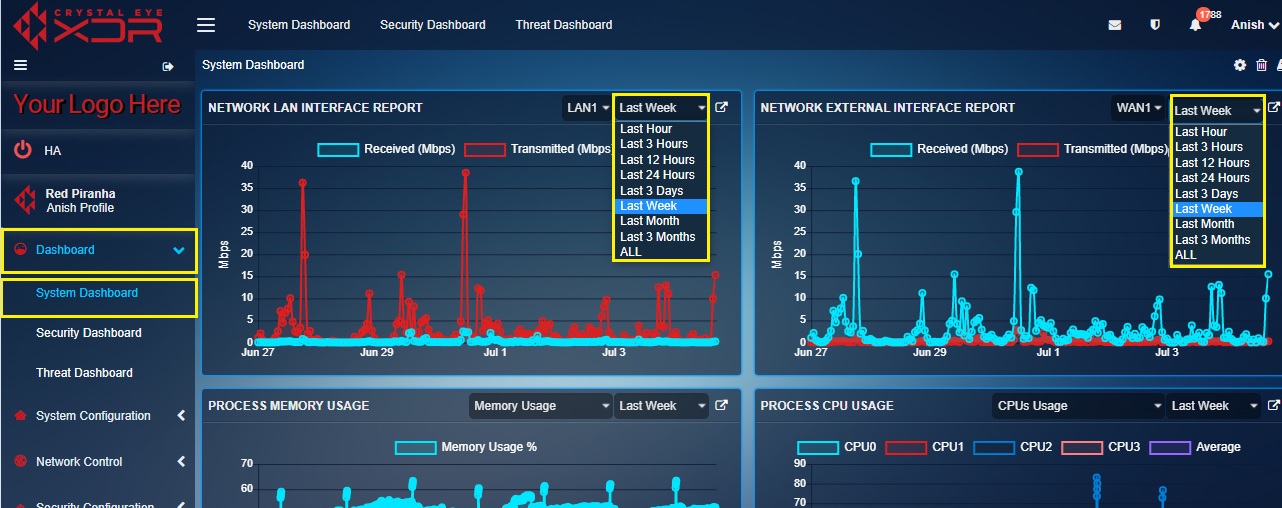
Note: By default, the system shows the data transmitted and received over WAN and LAN from the past week. However, you can view data of other interfaces by selecting them in the dropdown shown below.
Step 2: Hover your cursor over the dots on the green and the red curve of the graph to know the amount of data received and transmitted (in Mbps) at a given point of time.
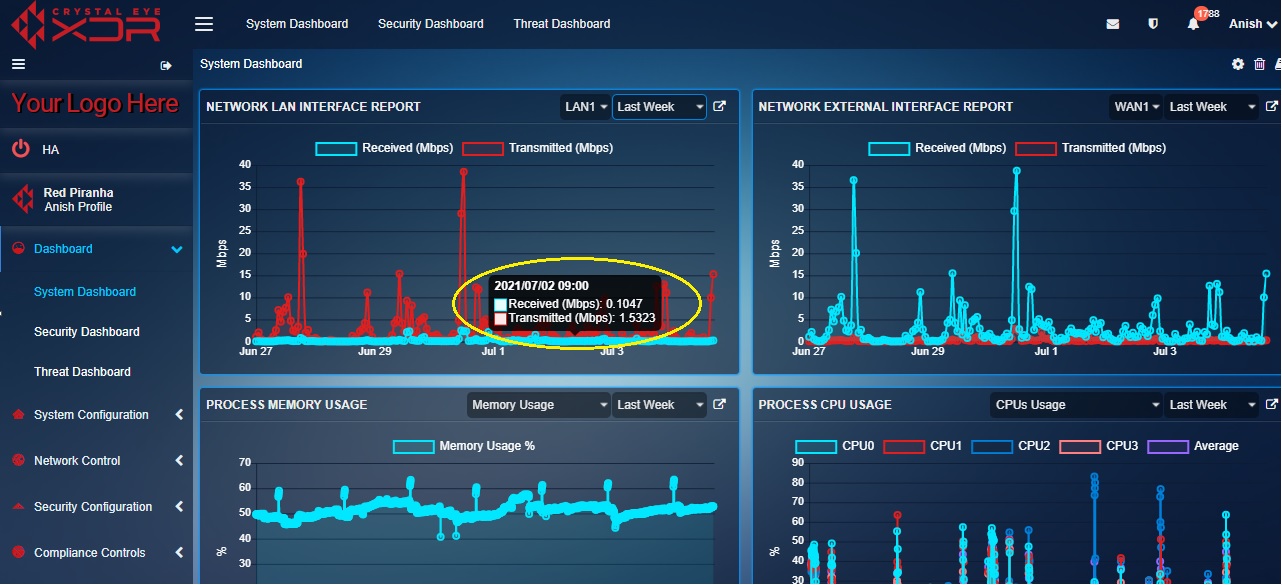
Note: In the above screenshot the green curve shows the data received (in Mbps) and the red curve shows the data transmitted (in Mbps). The details in the pop-up include Date, Time, Received (Mbps) and Transmitted (Mbps). The amount of received and transmitted data pertaining to LAN, WAN, and Wifi interface is captured on an hourly basis.
How to Segregate the Graph Data in the Network Interface Reports Widget?
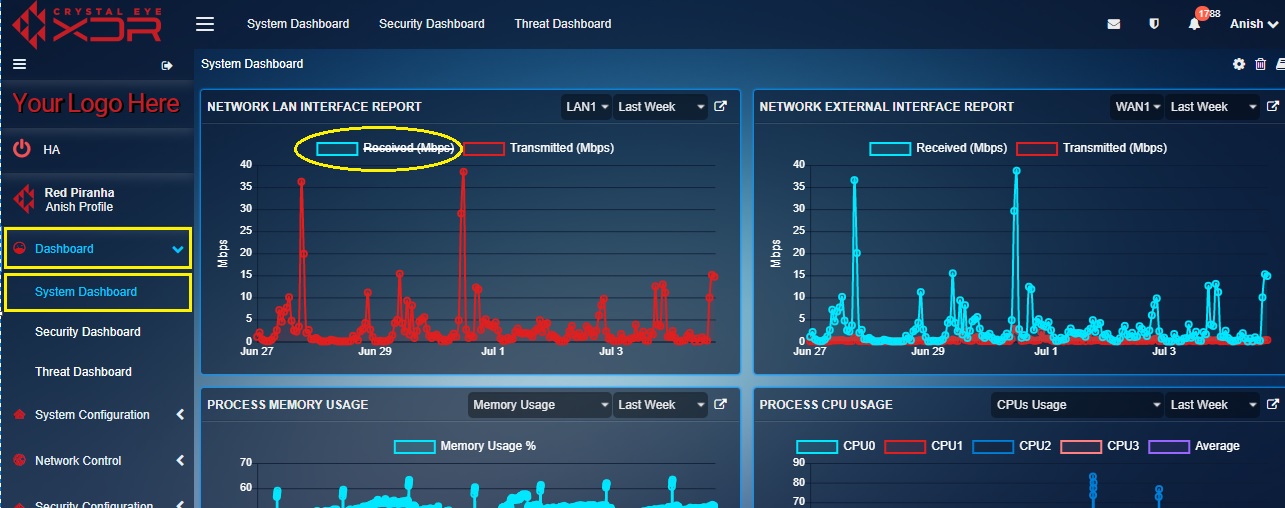
The network interface reports graph shows information related to both data received and transmitted over a given period of time. However, CE administrators can segregate data so as to display individual graph curves either showing data received or data transmitted. Perform the following steps to segregate the graph data.
Step 1: In the LAN network interface report widget, click Received (Mbps) or Transmitted (Mbps).
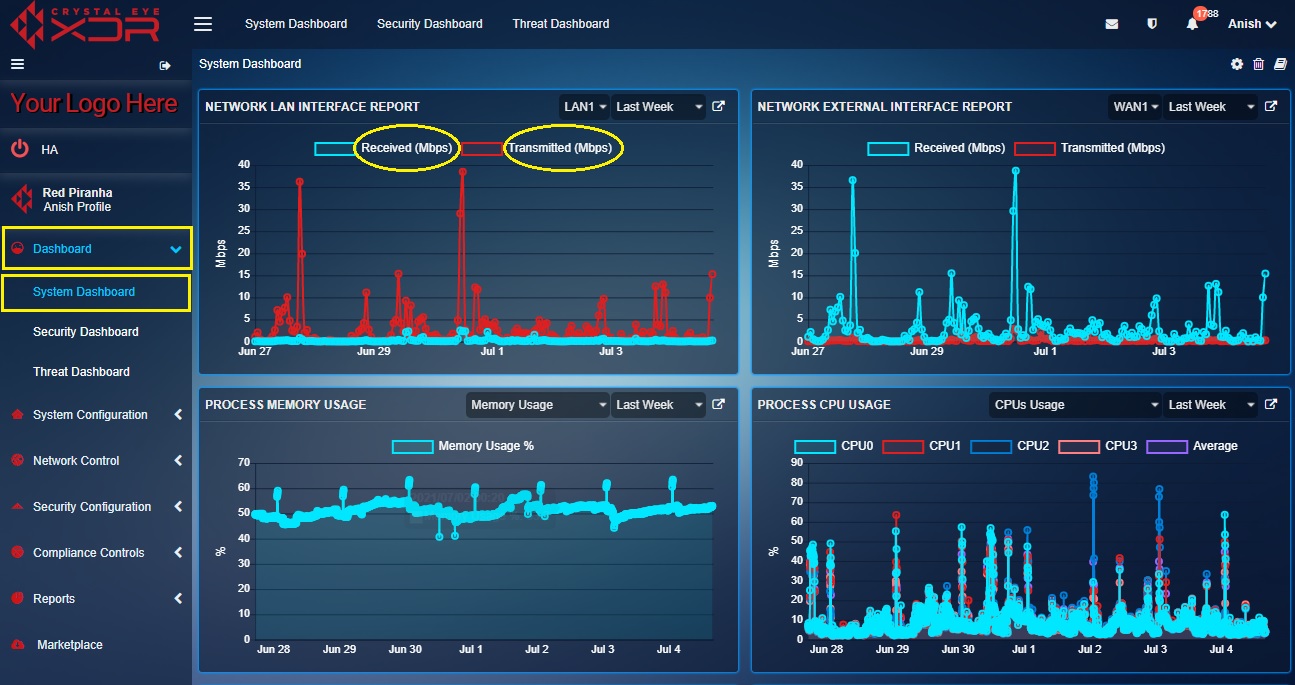
Note: In the screenshot above, the graph shows details related to both data received and transmitted. However, you can eliminate any one of them for data segregation purposes as shown in the screenshot below.
How to View a Detailed Version of Network Interface Reports?
As discussed above, the System Dashboard displays only LAN Interface Report and External Interface Report. However, a detailed version of these Network Interface Reports can be viewed in the Network Interface application under the Reports section. These detailed reports would provide data transmitted and received information (including time stamp) of all the network interfaces supported by the Crystal Eye appliance both in (graphical and tabular format which can be exported in PDF format as well). Click here to know more about Network Interfaces application.
Perform the following steps to view a detailed version of Network Interface Reports.
Step 1: In the LAN network interface reports widget, click the link icon at the top-right corner of the LAN Interface widget and WAN Interface widget (refer to the screenshot below).
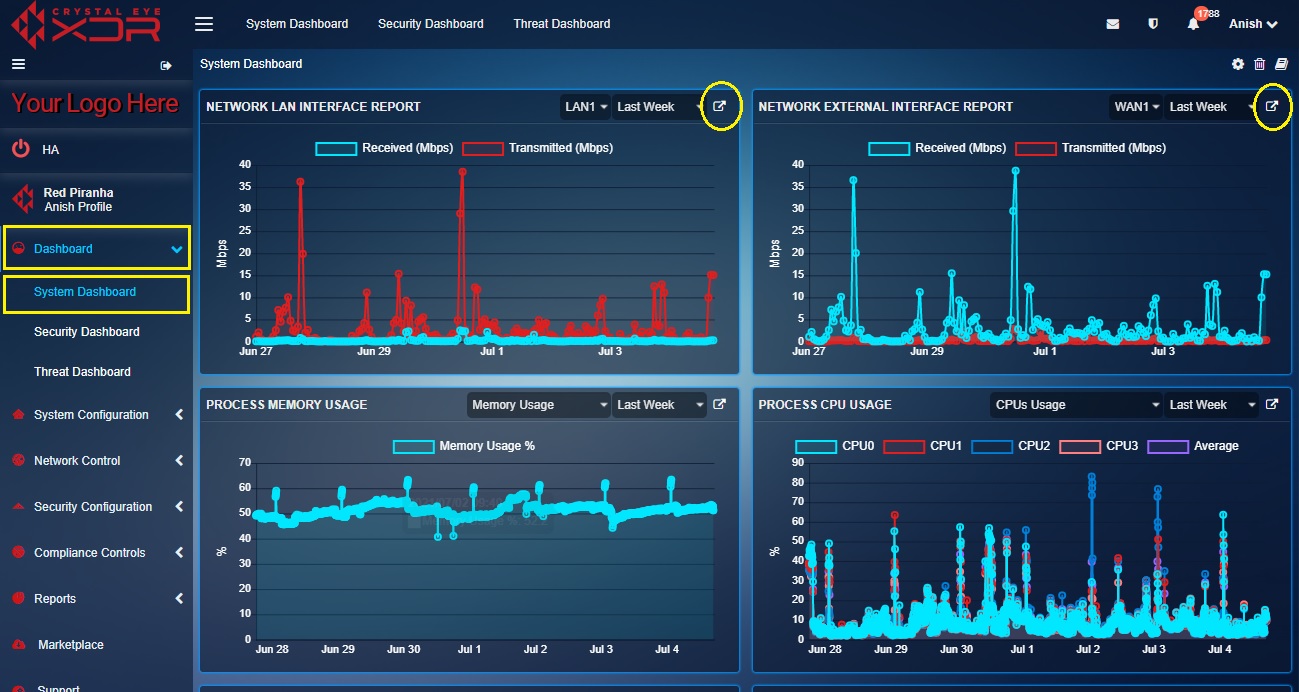
Note: Once you perform the above step, you will now be directed to the Network Interfaces application which is a part of the Reports category of the Crystal Eye XDR on-premise. The Network Interfaces application has as a stockpile of all the interfaces of the on-premise Crystal Eye XDR. The detailed information of all the interfaces (including wireless interface) can be viewed and a PDF report of the same can be generated. The reports would provide insights on how much data was transmitted or received over a particular period of time on a particular network interface. Know more about Network Interfaces application.
The Process CPU Usage widget offers a graphical representation of various procedural work handled by the Central Processing Units of the Crystal Eye XDR on-premise. The administrator can use the widget to know CPU Utilization Percentage of all the 4 CPUs and the average utilization percentage of all the CPUs. Some of the major procedural works handled by the CPUs of the Crystal Eye appliance are related to CE Dashboard, Log Reporting, IDS & IPS, Console Terminal etc.
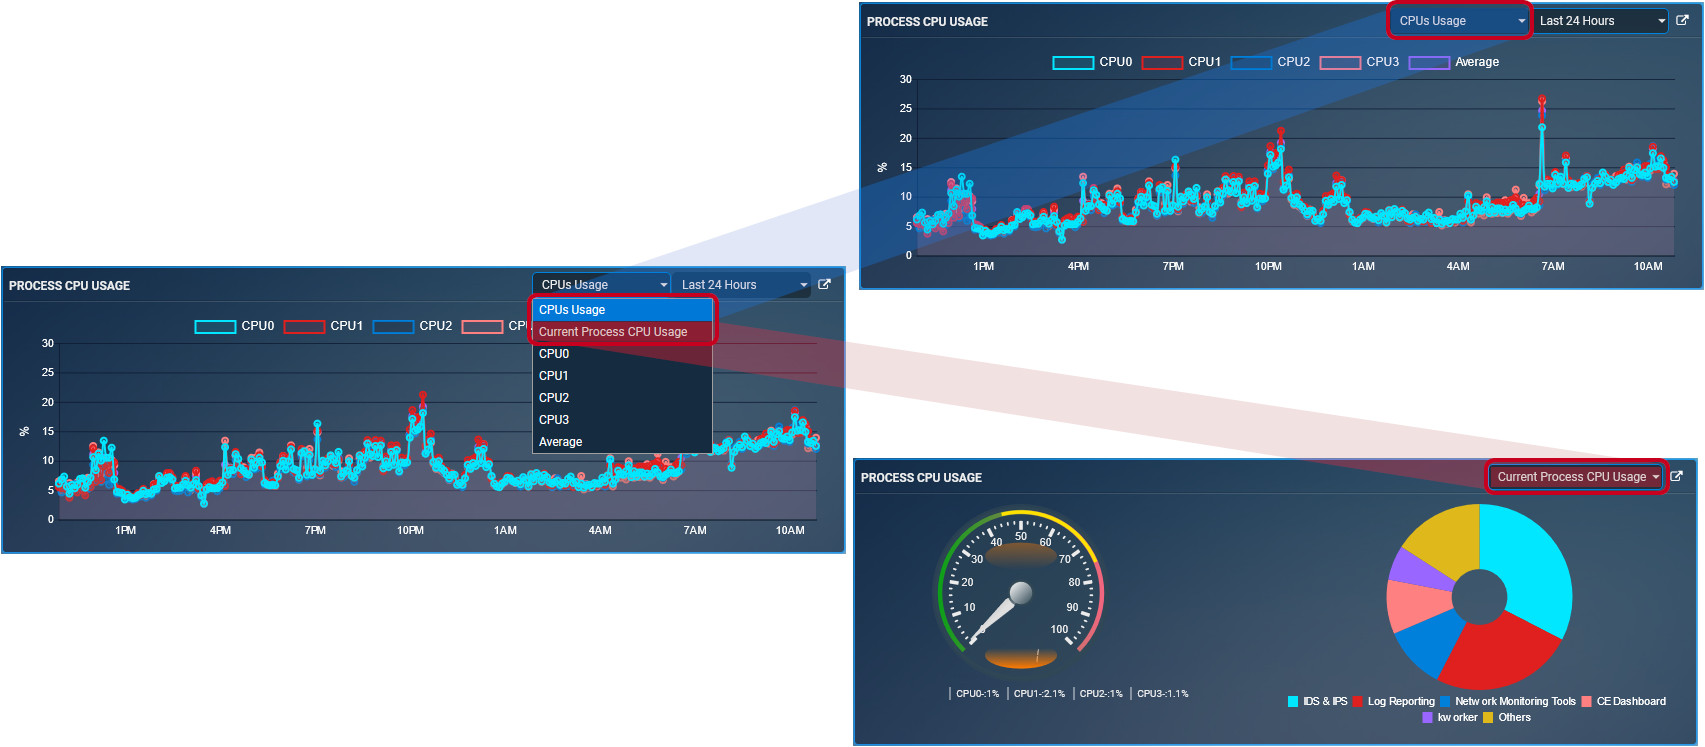
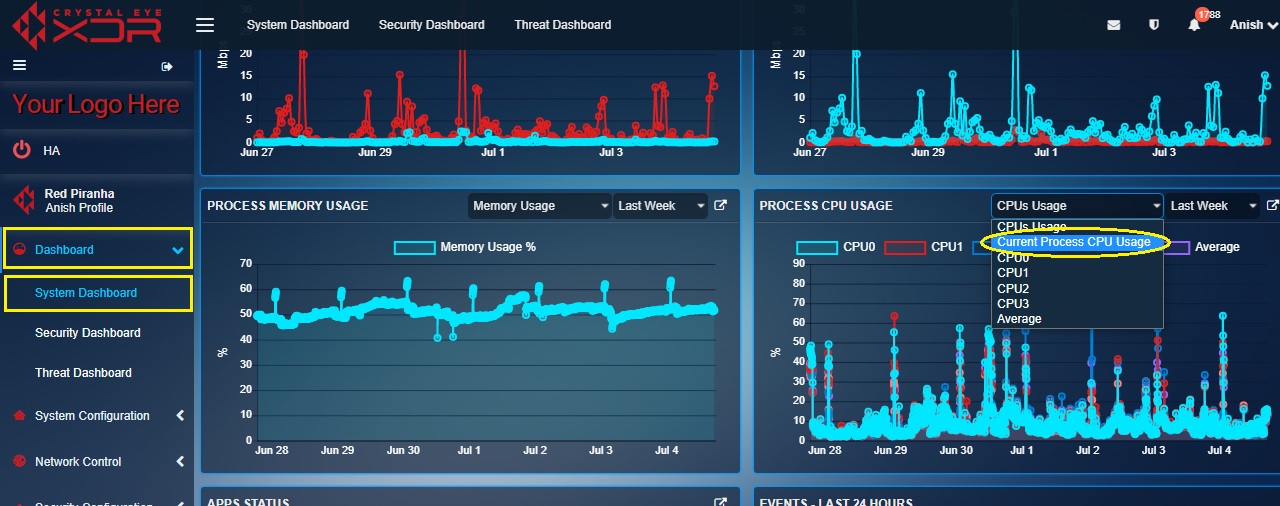
The Process CPU Usage widget has a switch functionality that can be used to view both CPUs Usage which is the CPU usage percentage and Current Process CPU Usage (Refer to the screenshot below)

What is CPU Usage? How to Interpret the Graphical Data Displayed in the CPUs Usage Graph?
Crystal Eye has multiple CPUs that perform procedural works related to CE Dashboard, Log Reporting, IDS & IPS, Console Terminal etc. The CPU Usage widget displays graphs that show utilization percentage of each CPU in the Crystal Eye appliance. It also shows the average utilization percentage of all the CPUs. The fact that this data can be fetched for a specific period of time makes it easier to monitor overactive CPU usage in CE.
Perform the following steps to interpret the data displayed in CPUs usage graph:
Step 1: In the Process CPU Usage widget, select the time period for which the data is required from the Time Period dropdown.
Note: You will notice that the widget shows the CPU usage graph of all the CPUs and also shows the average CPU utilization graph. In order to enhance visibility of individual graphs, some of the graphs can be eliminated so that the one that has not been eliminated stands out. This has been done below in Step 2.
Step 2: Select the CPUs color icon in the top panel of the widget to eliminate the ones not required in the graph. In the screenshot below, we will eliminate CPU-0 related data.
Note: The x-axis shows the time period and the y-axis shows utilization percentage.
Step 3: Hover the cursor over the graph to view the utilization percentage of all the CPUs of the Crystal Eye XDR on-premise at a particular date and time.
What is Current Process CPU Usage? How to Interpret the Graphical Data Displayed in Current/Real Time CPU Usage Indicators?
The Current Process CPU Usage switch view provides real time data related to CPU utilization with respect to various procedural tasks performed/handled by the Crystal Eye XDR on-premise such as CE Dashboard, Log Reporting, IDS & IPS, Console Terminal etc.
The graphic user interface of the Current Process CPU Usage is divided into two components (both the components have been highlighted in the screenshot below):
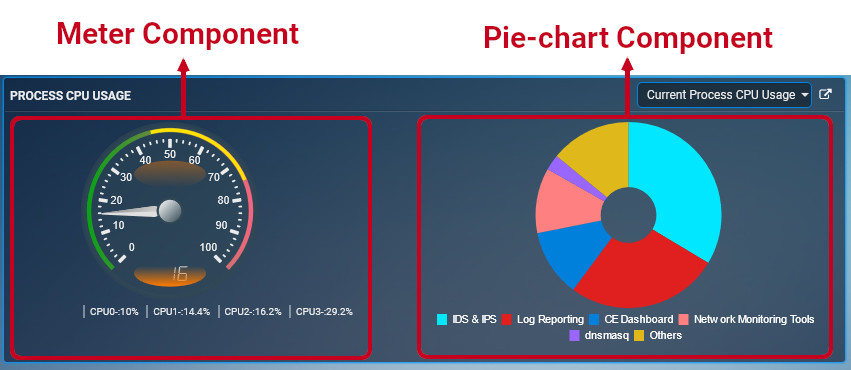
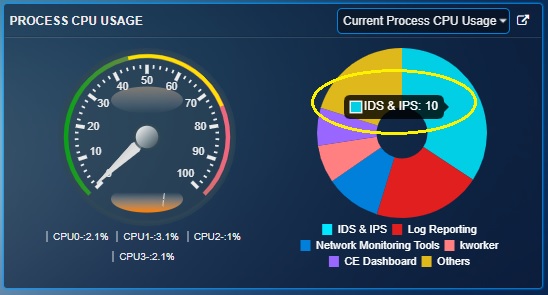
[A] Meter Component: The meter provides a real-time glimpse of the average CPU utilization whereas the current utilization percentage of each CPU is mentioned below the meter.
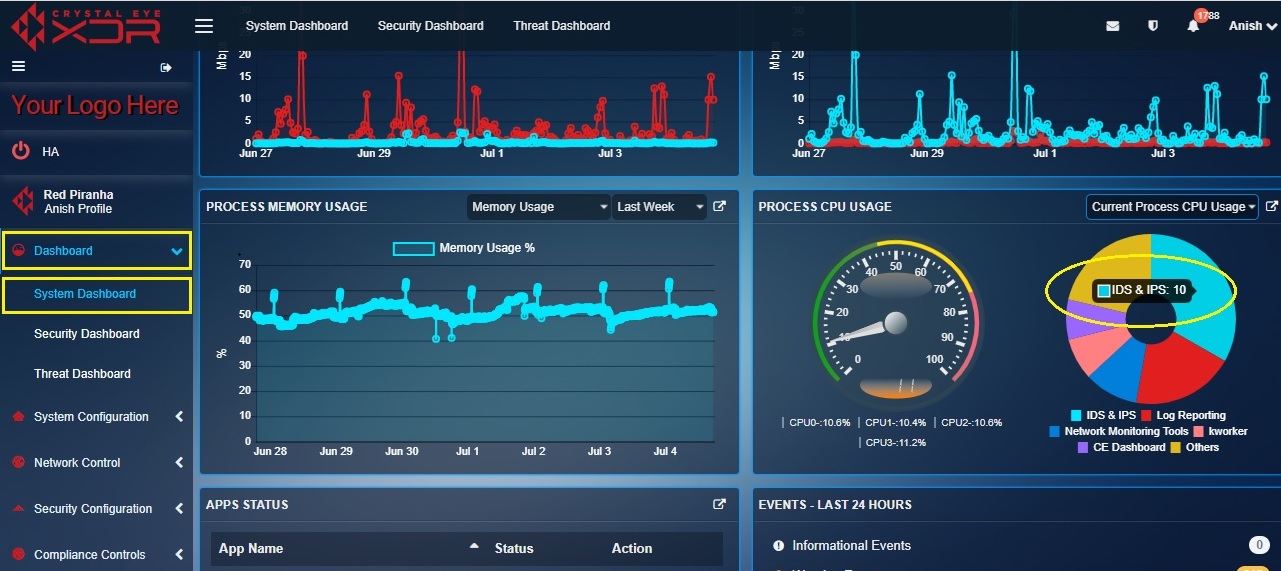
[B] Pie-Chart Component: The pie-chart shows the various procedural tasks handled by the Crystal Eye XDR on-premise such as CE Dashboard, Log Reporting, IDS & IPS, Console Terminal. Hover the cursor over the pie-chart to see the extent of CPU utilization for that particular task. For example, in screenshot below, on hovering the cursor over the green part of the pie-chart you will see a pop-up “IDS & IPS: 10%”. This means that the tasks related to IDS & IPS is taking up 10% of the CPU of the Crystal Eye XDR on-premise.
Perform the following steps to interpret the Graphical Data Displayed in Current/Real Time CPU Usage Indicators:
Step 1: In the Process CPU Usage widget, select Current Process CPU Usage from the dropdown.
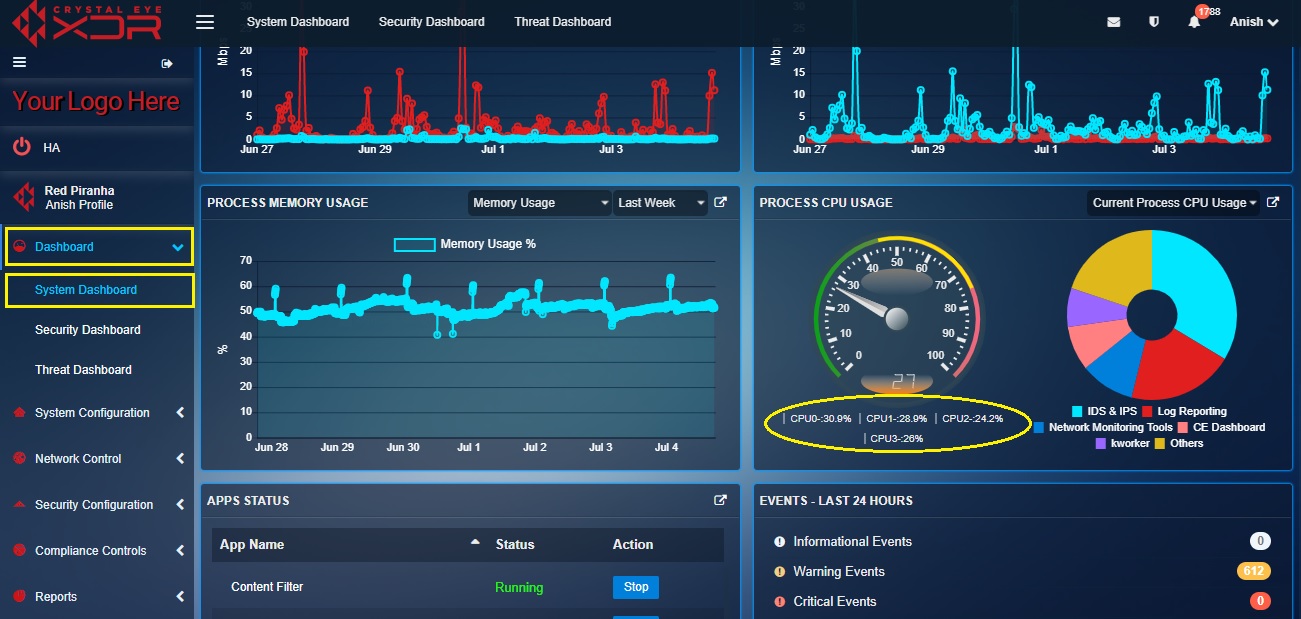
Step 2: You will now see the Current Process CPU Usage switch view. View the real-time CPU utilization percentage of each CPU of the CE appliance (highlighted in the screenshot below).
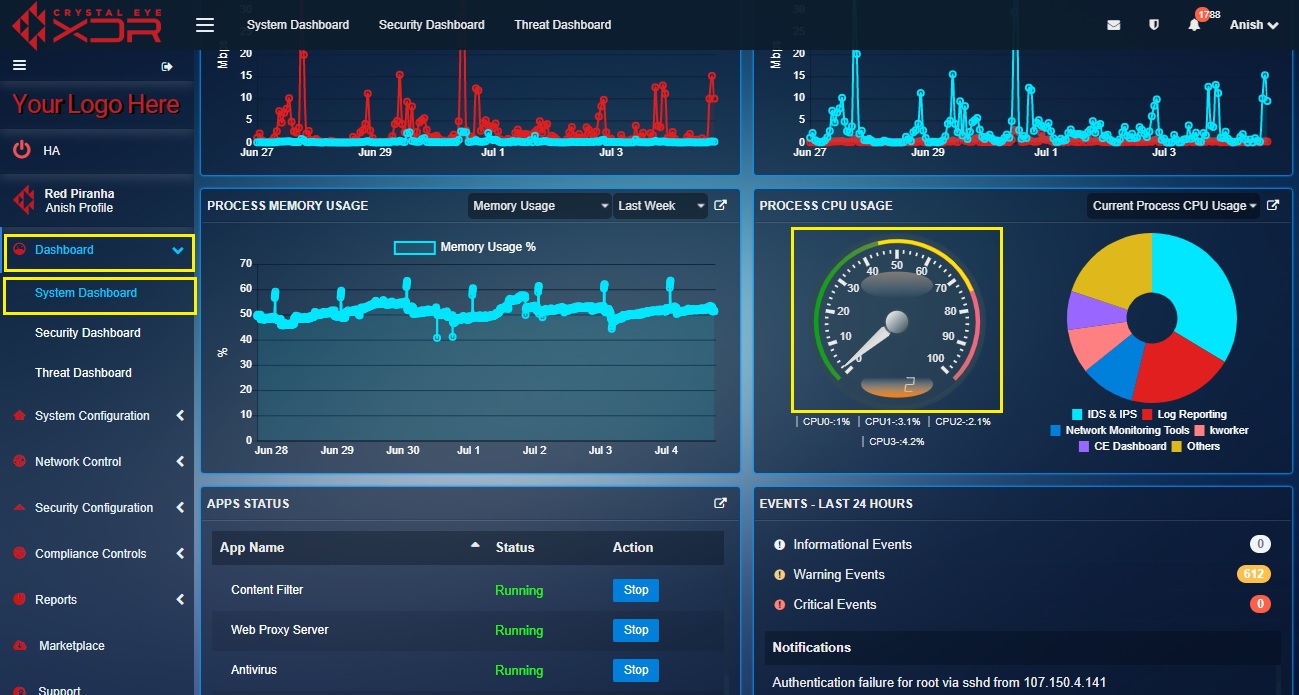
Step 3: View the average CPU utilization on the meter component.
Step 4: Hover the cursor over the pie-chart to see how much CPU is utilized for a particular task. For example, in the screenshot below on hovering the cursor over the red part of the pie-chart you will see a pop-up IDS & IPS: 10%. This means that the tasks related to IDS & IPS is taking up 10% of one of the CPUs of the Crystal Eye XDR on-premise.
How to View Detailed System Related Information of Various Crystal Eye XDR on-premise CPUs?
As discussed above, the Process CPU Usage widget provides utilization percentage details of each CPU of the Crystal Eye appliance with respect to various procedural tasks handled. However, the CE administrator can gain access to other system related information of the Crystal Eye appliance through the System Report application. The System Report application (under the Reports section) can be accessed to refer to various system related information and file system summary. Click here to know more about System Report application.
Perform the following steps to view a detailed version of system related information of various CPUs of the Crystal Eye appliance:
Step 1: In the Process CPU Usage widget, click the link icon at the top-right corner.
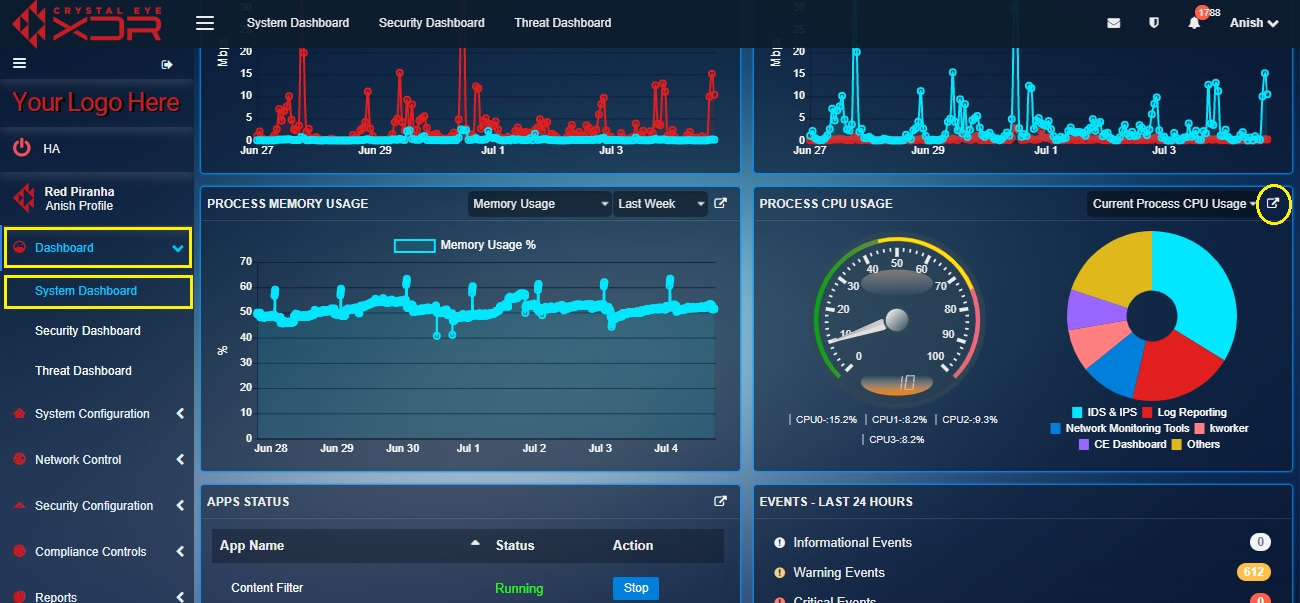
Note: Once you perform the above step, you will be directed to the System Report application which is a part of the Reports category of the Crystal Eye. By viewing and analysing the designated tables in this application, the administrator can know the version of the CE, Kernel Version, System Time, CPU Model, Memory Size, Uptime, and Load. Apart from this, there are other useful information provided such as the total size of internal disk space, its used space, available space and percentage of the space used.
The Process Memory Usage widget offers a graphical representation of the memory utilized while performing various procedural functions. The memory usage percentage is recorded and can be viewed for a particular time period. Some of the major procedural works handled by the Crystal Eye appliance is Log Reporting, Database, IDS & IPS, Vulnerability Manager and CE Dashboard.
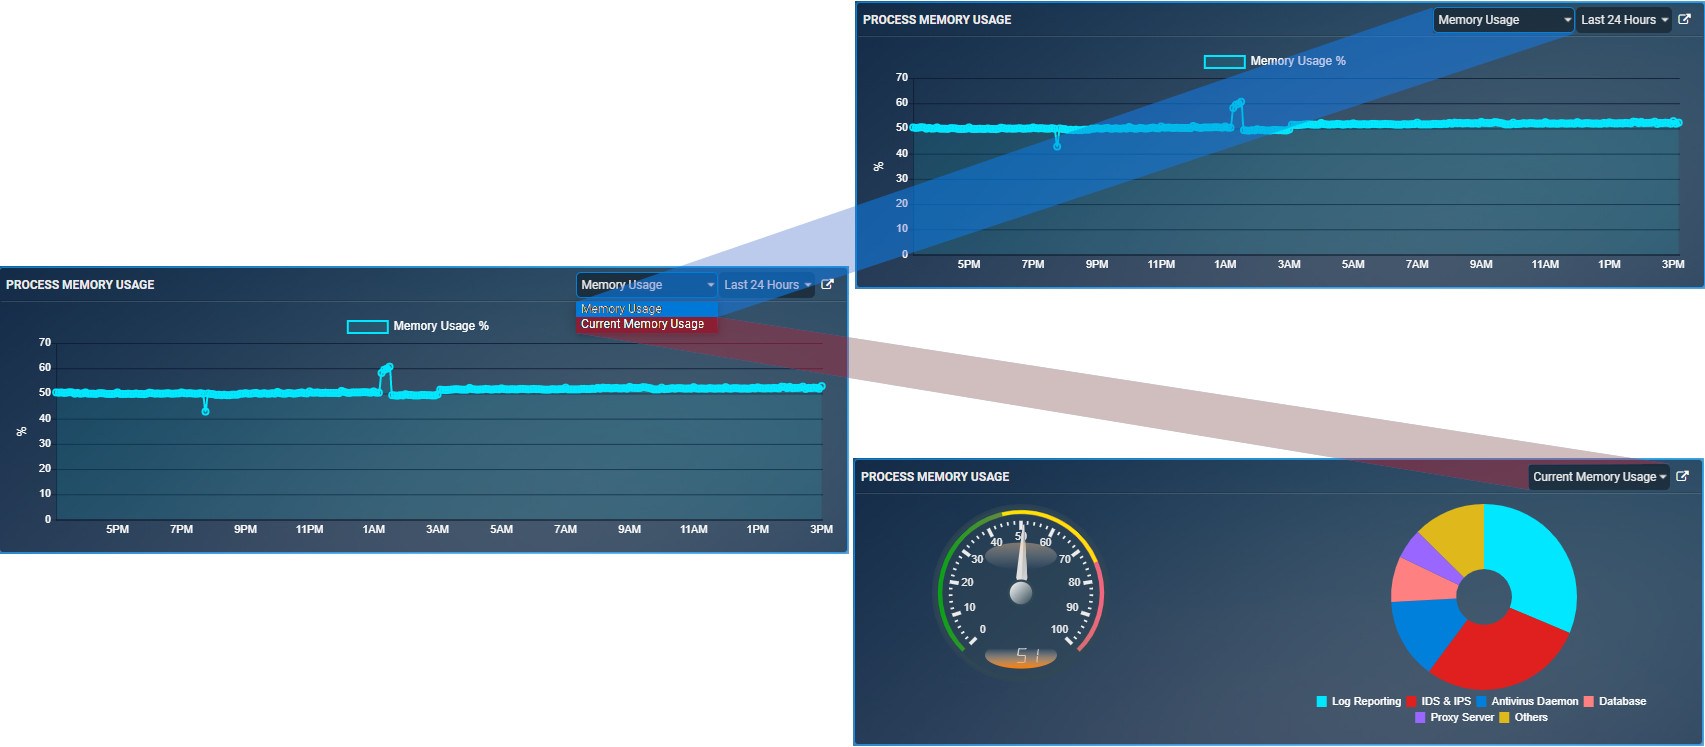
The Process Memory Usage widget has a switch functionality that can be used to view both memory usage percentage as per the time period selected and the current memory usage showing the memory usage of the Crystal Eye on a real-time basis (Refer to the screenshot below).
What is Memory Usage? How to Interpret the Graphical Data Displayed in the Memory Usage Graph?
The Crystal Eye memory supports multiple procedural works related to the CE dashboard, Log Reporting, IDS & IPS, Console Terminal etc. The Memory Usage widget displays graphs that show the extent to which the Crystal Eye memory is used while performing various tasks. The fact that this data can be fetched for a specific period of time makes it easier to monitor overactive Memory Usage in Crystal Eye.
Perform the following steps to interpret the data displayed in memory usage graph:
Step 1: In the Memory CPU Usage widget, select the time period for which the data is required from the Time Period dropdown.
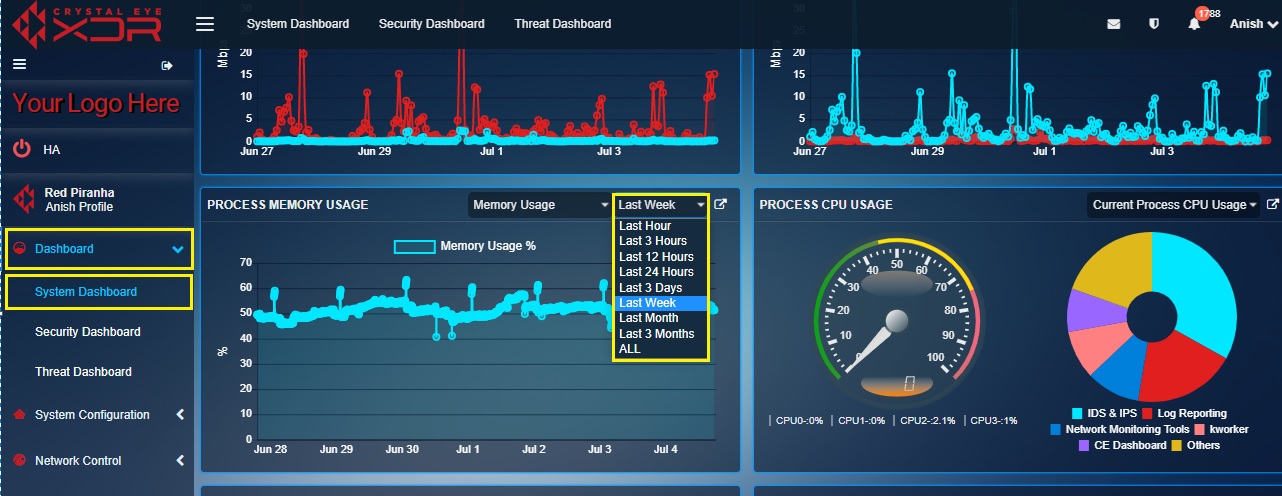
Step 2: Hover the cursor over the graph to view the memory utilization percentage of the Crystal Eye appliance at a given date and time.
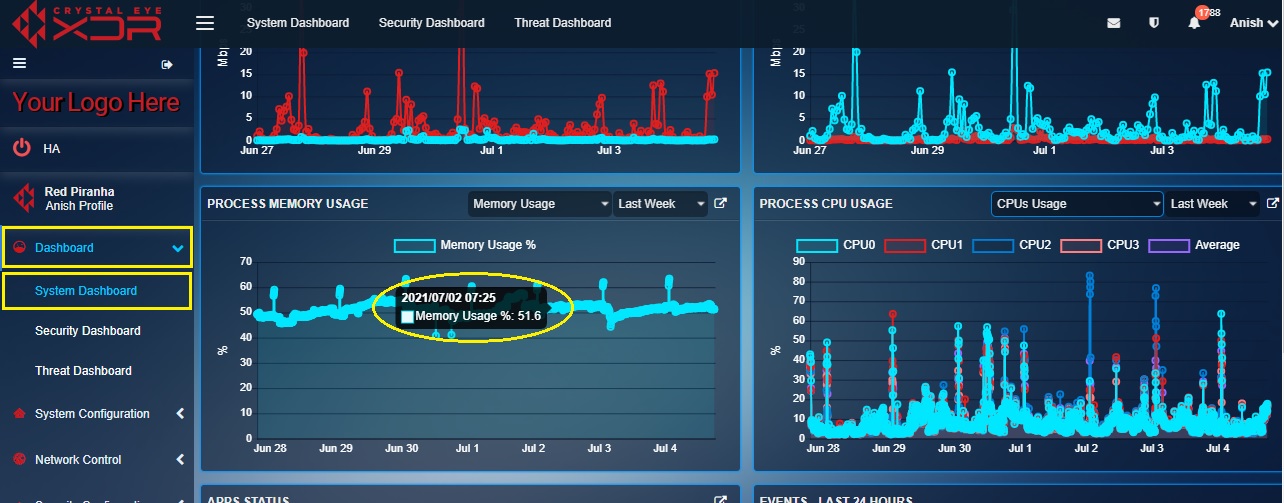
Note: When the cursor is hovered over a point on the graph which determines the memory utilization percentage at a particular period of time then the details regarding that pops-up on the graph as mentioned on the screenshot above.
What is Current Memory Usage? How to Interpret the Graphical Data Displayed in Current Memory Usage Indicators?
The Current Memory Usage switch view provides real time data related to the memory utilization with respect to various procedural tasks performed/handled by the Crystal Eye appliance such as CE Dashboard, Log Reporting, IDS & IPS, Console Terminal etc.
The graphic user interface of the Current Memory Usage is divided into two components (both the components have been highlighted in the screenshot below):
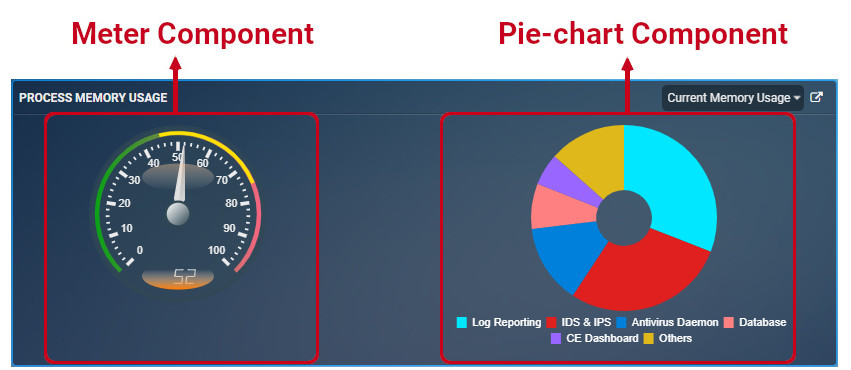
[A] Meter Component: The meter provides a real-time glimpse of the memory utilization percentage of the Crystal Eye appliance.
[B] Pie-chart Component: The pie-chart shows the various procedural works handled by the CE such as CE Dashboard, Log Reporting, IDS & IPS, Console Terminal. Hover the cursor over the pie-chart to see the extent to which the memory of the Crystal Eye appliance has been utilized while performing a particular procedural task. For example, in the screenshot below, on hovering the cursor over the green part of the pie-chart, you will see a pop-up “Log Reporting: 7.8%”. This means that the tasks related to Log Reporting is utilizing 7.8% of the memory of the Crystal Eye appliance.
Perform the following steps to interpret the graphical data displayed in current/real time CPU Usage Indicators:
Step 1: In the Process Memory Usage widget, select Current Memory Usage from the dropdown.
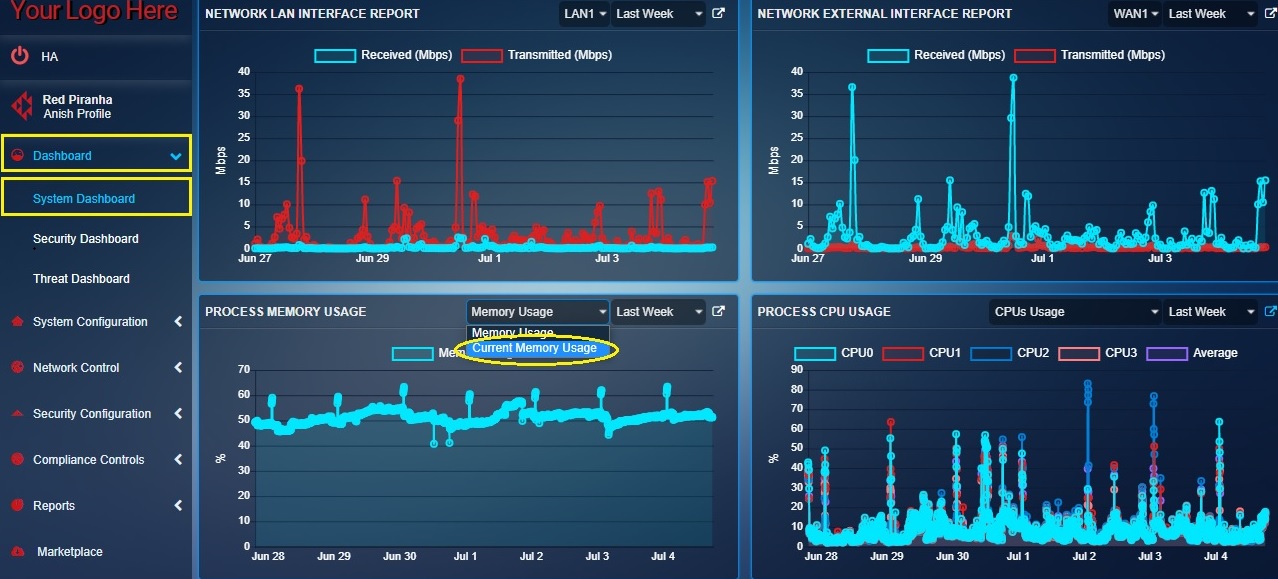
Step 2: You will now see the Current Memory Usage switch view. View the real-time memory utilization percentage of the Crystal Eye appliance (highlighted in the screenshot below).
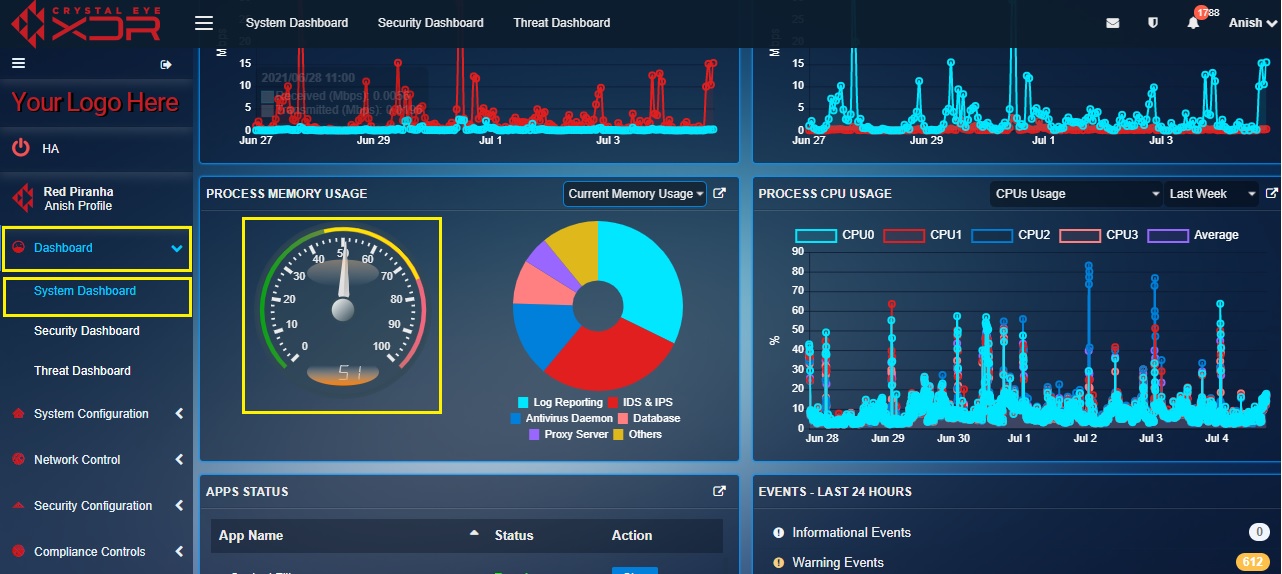
Step 3: Hover the cursor over the pie-chart to see how much memory is utilized to pursue a particular procedural task. For example, in the screenshot below, on hovering the cursor over the red part of the pie-chart you will see a pop-up “Log Reporting: 16.6%”. This means that the tasks related to Log Reporting is taking up 10% of the memory of the Crystal Eye XDR on premise.

How to View Detailed System Related Information of the Crystal Eye Appliance?
As discussed above, the Process Memory Usage widget provides utilization percentage details of the memory of the Crystal Eye appliance with respect to various procedural tasks handled. However, the CE administrator can gain access to other system related information of the Crystal Eye appliance through the System Report application. The Sytem Report application (under the Reports section) can be accessed to refer to various system related information and file system summary. Click here to know more about System Report application.
Perform the following steps to view a detailed version of system related information of the Crystal Eye appliance:
Step 1: In the Process Memory Usage widget, click the link icon at the top-right corner.

Note: Once you perform the above step, you will be directed to the System Report application which is a part of the Reports category of the Crystal Eye. By viewing and analyzing the designated tables in this application, the administrator can know the version of the CE, Kernel Version, System Time, CPU Model, Memory Size, Uptime, and Load. Apart from this, other useful information can also be viewed such as the total size of internal disk space, its used space, available space and percentage of the space used.
The App Status widget provides information about the running status of 7 main services of the Crystal Eye appliance. These applications that are featured here on this widget are Content Filter, Web Proxy Server, Antivirus, Intrusion Protection & Detection, Log Processing and Reporting, Forcefield, and Incident and Event Services (SIEM). The CE administrator can Start or Stop the services of these applications at a click of a button from the System Dashboard.
Note: The Start and Stop feature are only available for seven selective Crystal Eye services.
How to Start or Stop Services Running on a Crystal Eye appliance from the System Dashboard?
Step 1: In the Apps Status widget, click the Start button under the Action column.
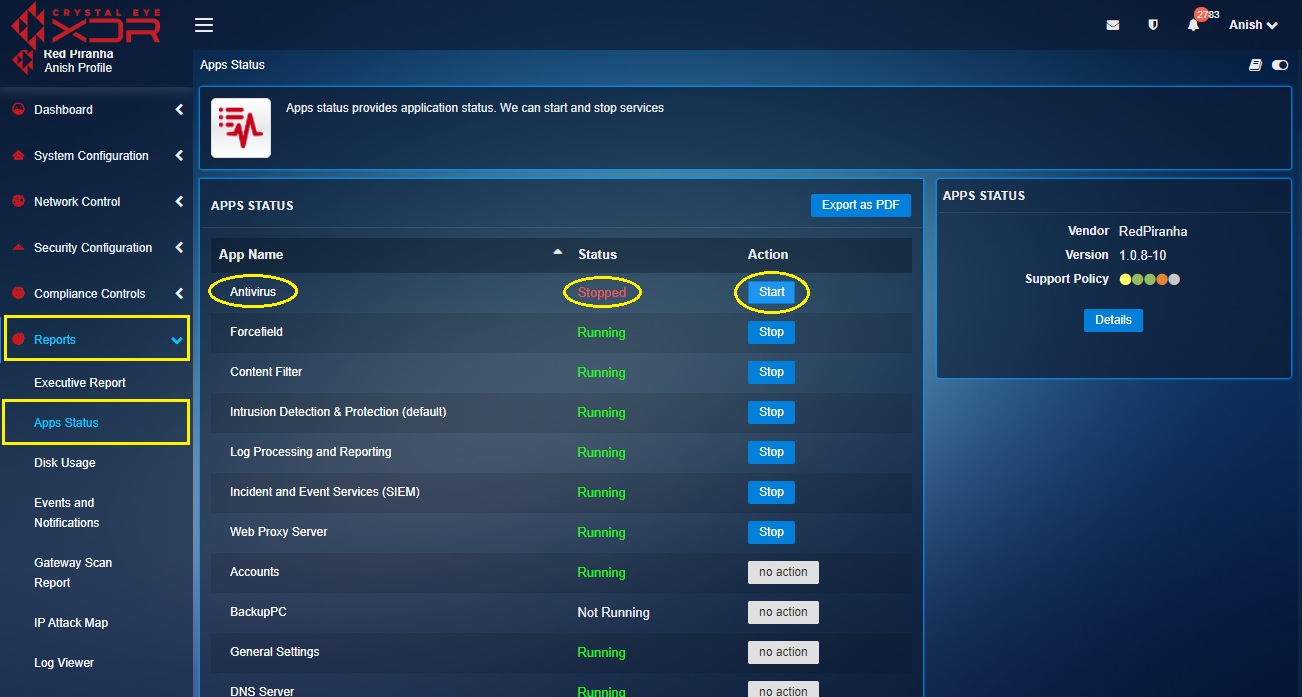
Note: In the screenshot above the status of the Content Filter application is ‘Stopped’. The Content Filter services will initiate once the Start button is clicked.
Step 2: In the Apps Status widget, click the Stop button under the Action column.
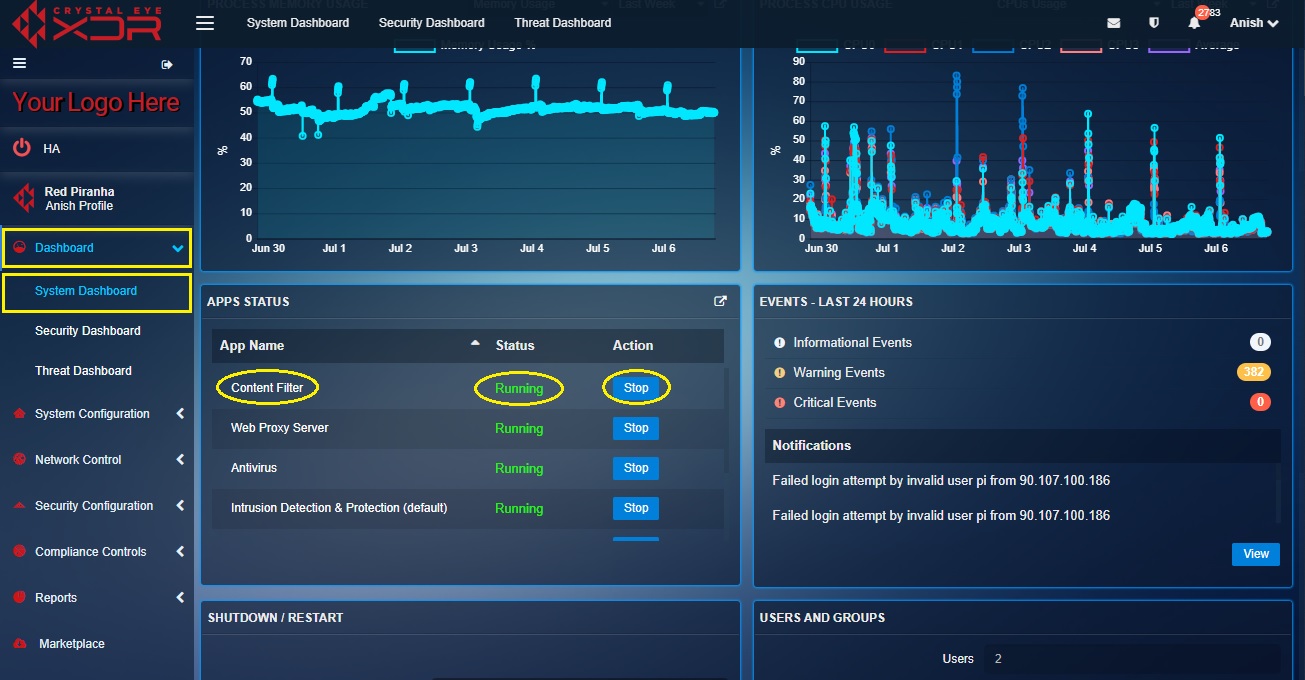
Note: In the screenshot above the status of the Content Filter application/Service is ‘Running’. The Content Filter services will initiate once the Stop button is clicked.
How to Fetch a PDF Report that Shows the App Running Status of all the Applications Installed in the Crystal Eye Appliance?
As discussed above, the Apps Status widget provides information about the running status of 7 main services of the Crystal Eye appliance. However, CE administrators can gain access to a comprehensive PDF report that provides information about the running status of all the applications installed in the Crystal Eye appliance. Apart from this, the PDF report also shows the application name and its description.
Step 1: In the App Status widget, click the link icon at the top-right corner.

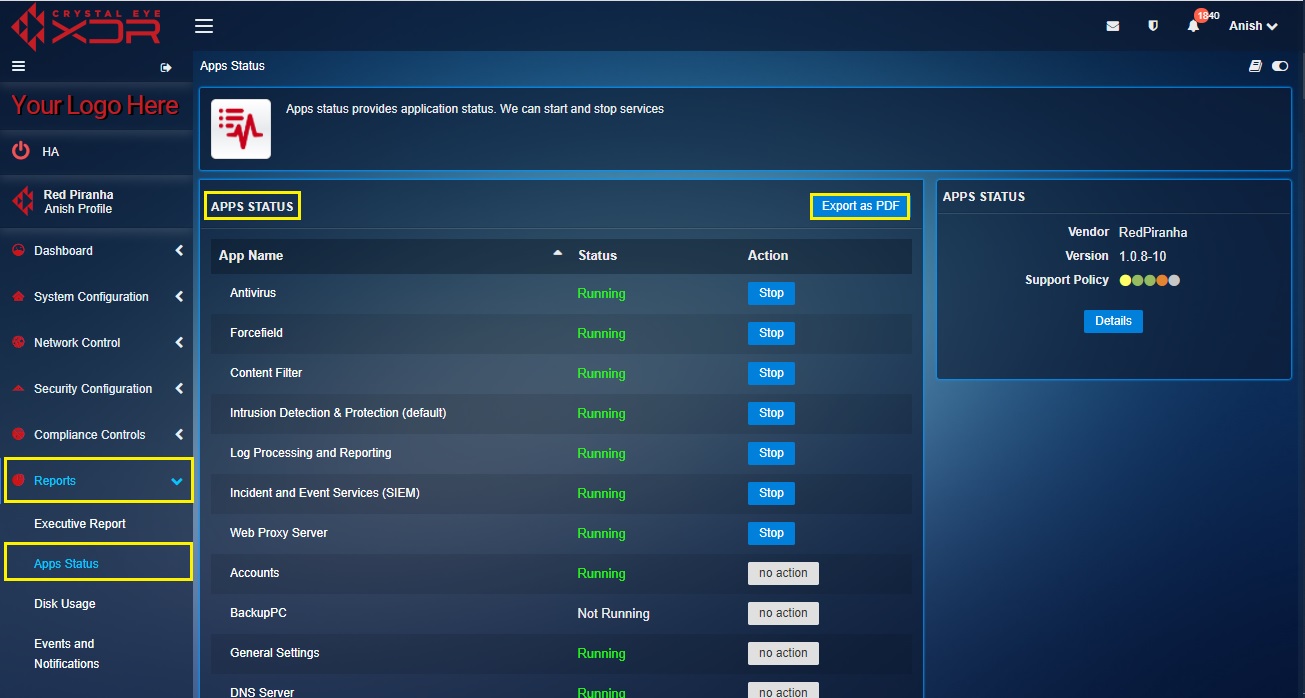
Note: Once you perform the above step, you will be directed to the App Status application which is a part of the Reports category of the Crystal Eye.
Step 2: You will now be directed to App Status application which is categorized under the Reports Category. Click the Export as PDF button.
Step 3: You will now see the PDF format of the App Status report. View the App Name, Status, and the App Description.
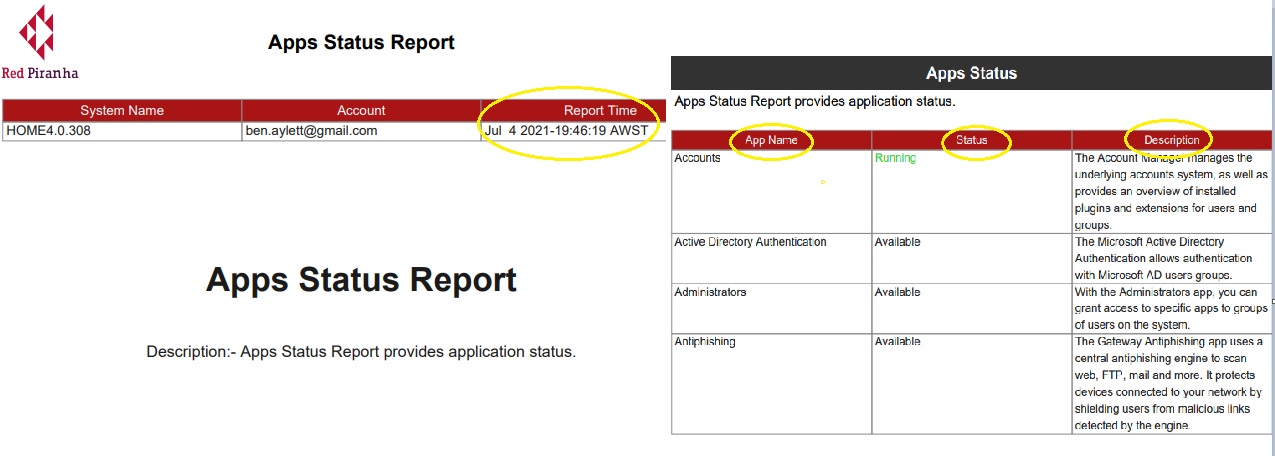
Note: The App Name column shows the name of the application and the column corresponding to it shows the App Status shedding light on the application status. The application status can be ‘running’ or ‘stopped’. The column on the far right end of the report has the description of each application of the Crystal Eye appliance. The report also has a dedicated section that shows the date and time at which the report was generated.
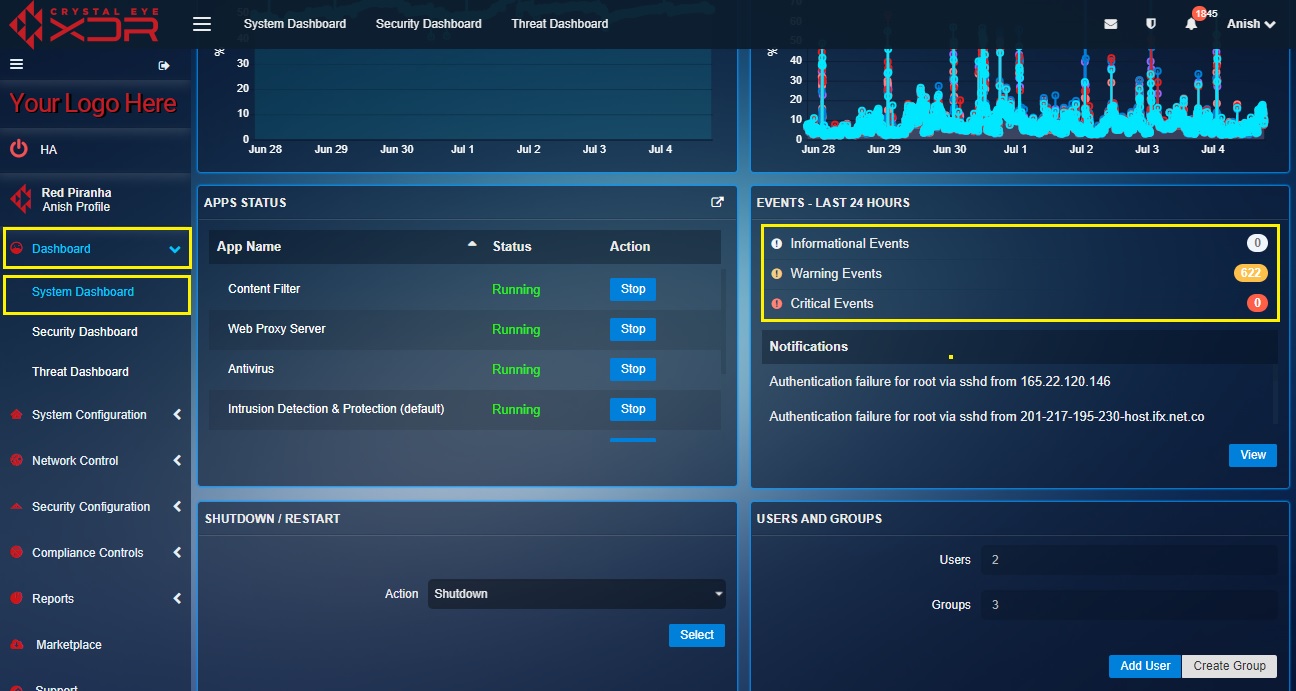
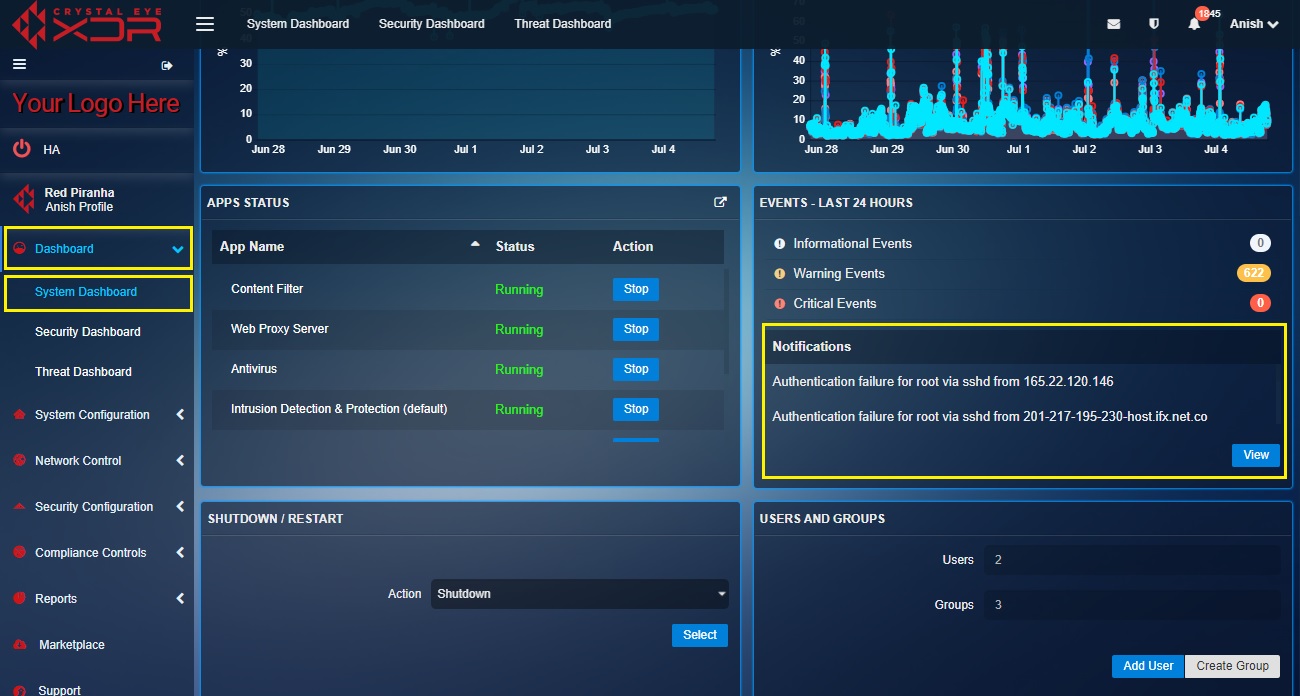
The Event Logs widget provides real-time information about various types of system events occurred in the Crystal Eye XDR on-premise network over the past 24 hours. The widget has a dedicated overview section that displays all CE events and categorizes it as Informational Events, Warning Events and Critical Events. The Notifications section displays an elaborative format of the event specifying the event type and the IP address associated with the event.
How to View Events/Logs Details & System Generated Notifications for the Past 24 Hours?
Step 1: In the Events Logs widget, you will be able to view the total amount of Informational Events, Warning Events and Critical Events (refer to the screenshot below).
Step 2: Now use the scroll bar to view all the notifications that have popped-up in the past 24 hours.
How to Fetch a Detailed Report in PDF Format that Provides Information of Various Events/Logs?
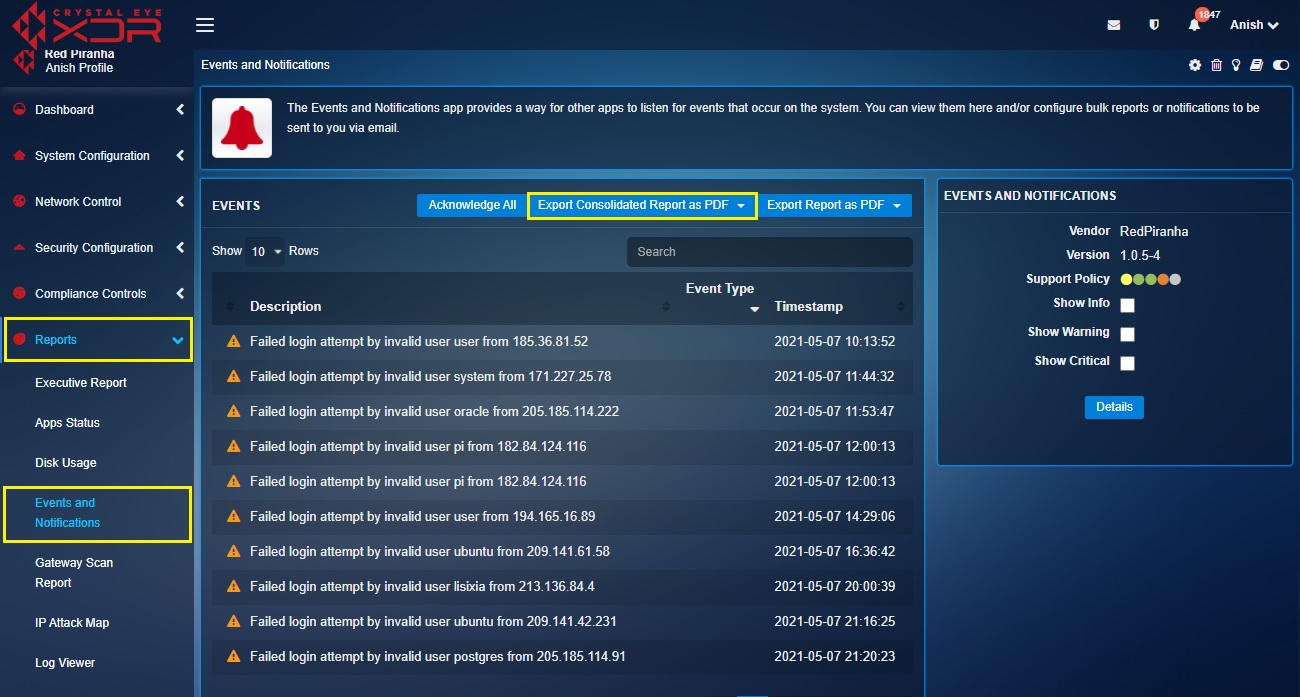
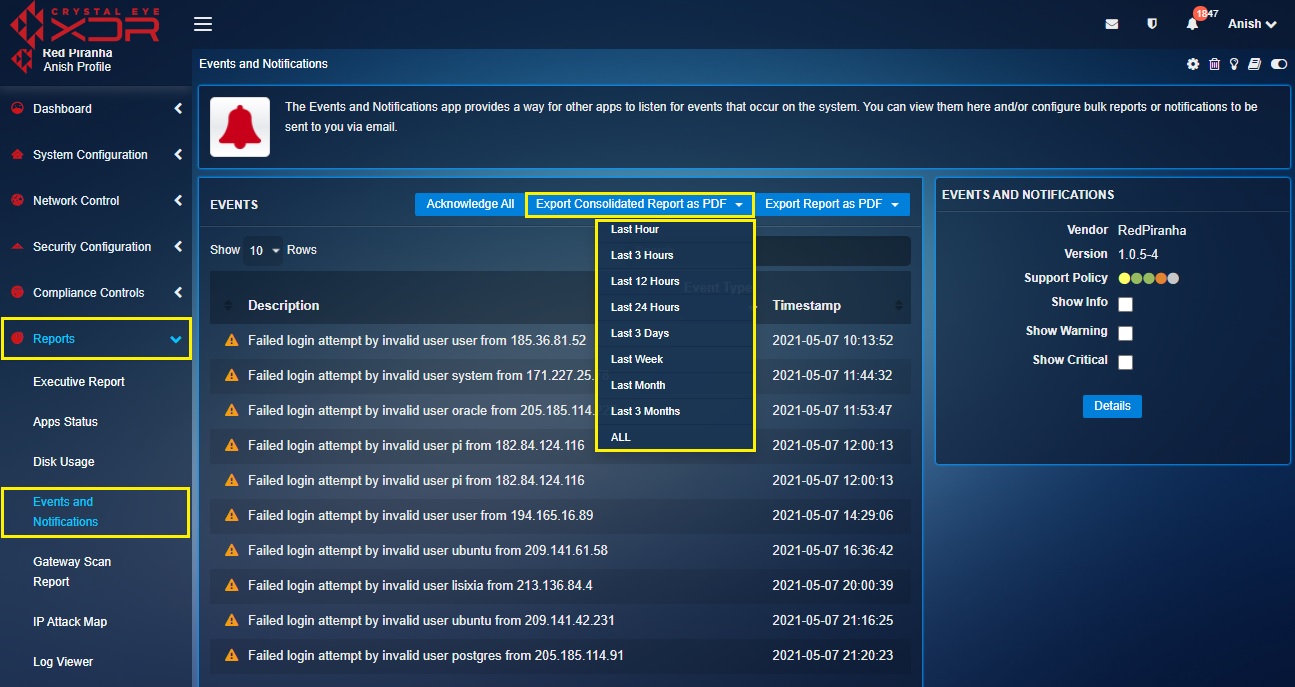
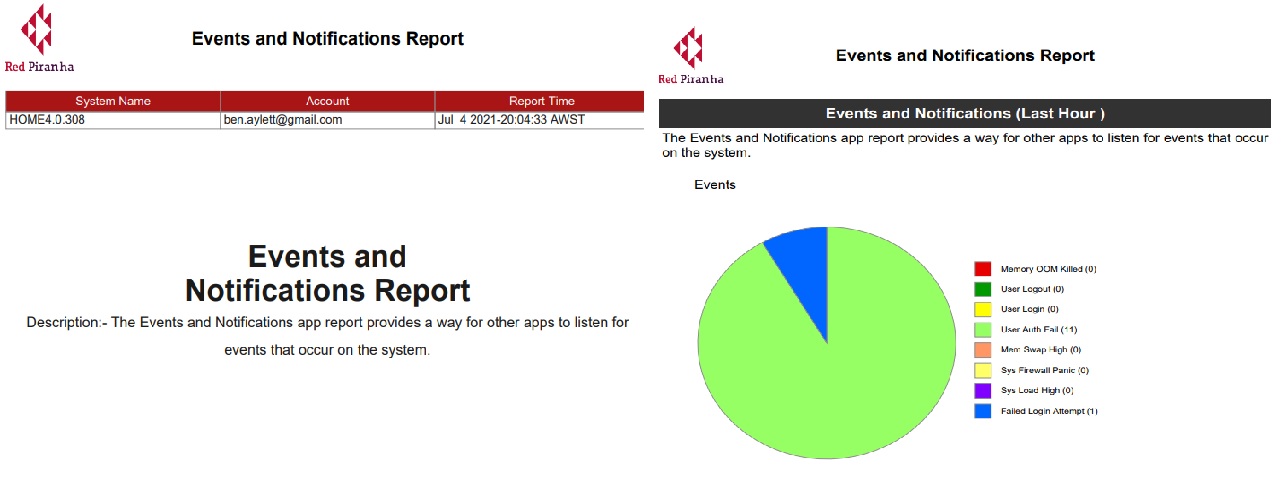
As discussed above, the Event Logs widget provides real-time information about various types of system events occurred in the Crystal Eye network over the past 24 hours. However, CE administrators can gain access to a comprehensive PDF report that provides information of the various events logged by the Crystal Eye appliance. The two types of reports generated by CE here are the consolidated report and the regular report. The consolidated report shows a pie chart denoting various event types, where as the regular report shares information about each Event Type, Event Description and the Timestamp in tabular format.
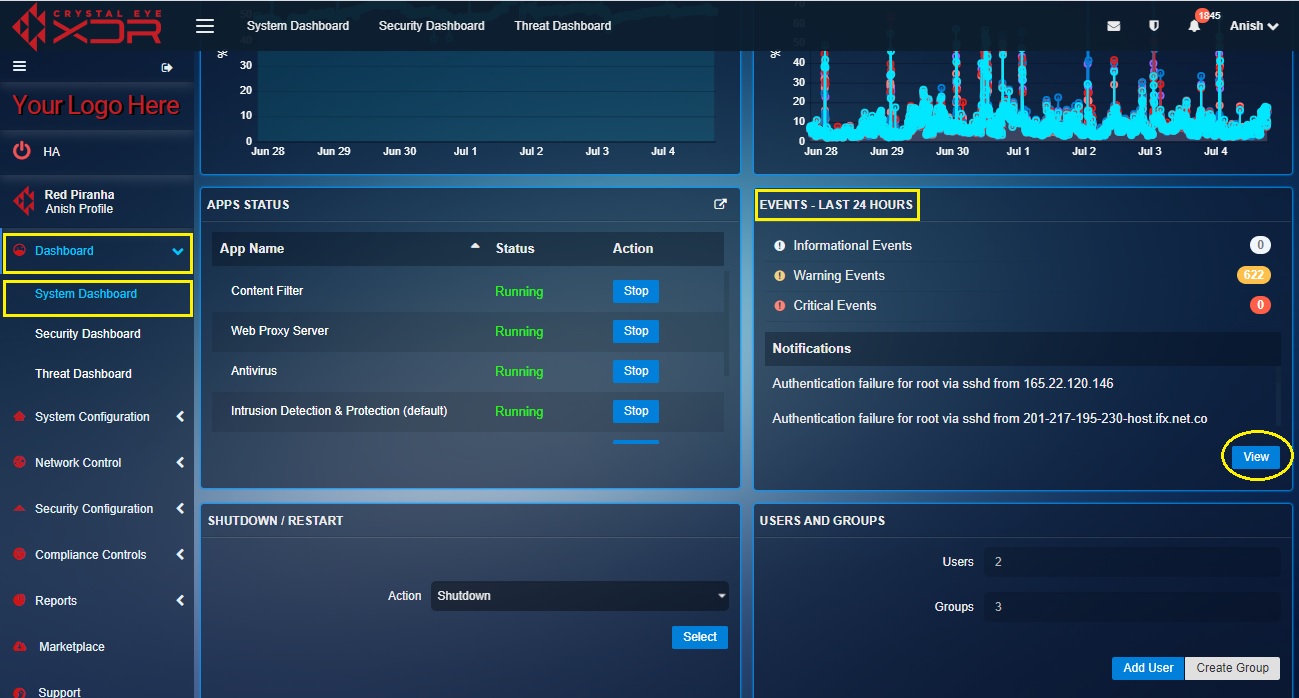
Step 1: In the Events Logs widget, click the View button at the bottom right corner of the widget.
Step 2: You will now be directed to the Events and Notification application page. Click Export Consolidated Report as PDF button.
Step 3: Select the time period for which the report is to be generated.
The PDF document of the report will now open on your browser. As highlighted in the screenshot below, there are 8 different event types that can be triggered and denoted in the consolidated report pie chart. The event types that are highlighted and flagged here are Memory OOM Killed, User Logout, User Login, User Auth Fail, Mem Swap High, Sys Firewall Panic, Sys Load High and Failed Login Attempt. The date and time at which the report was downloaded is a also displayed in the top-right corner of the PDF report.
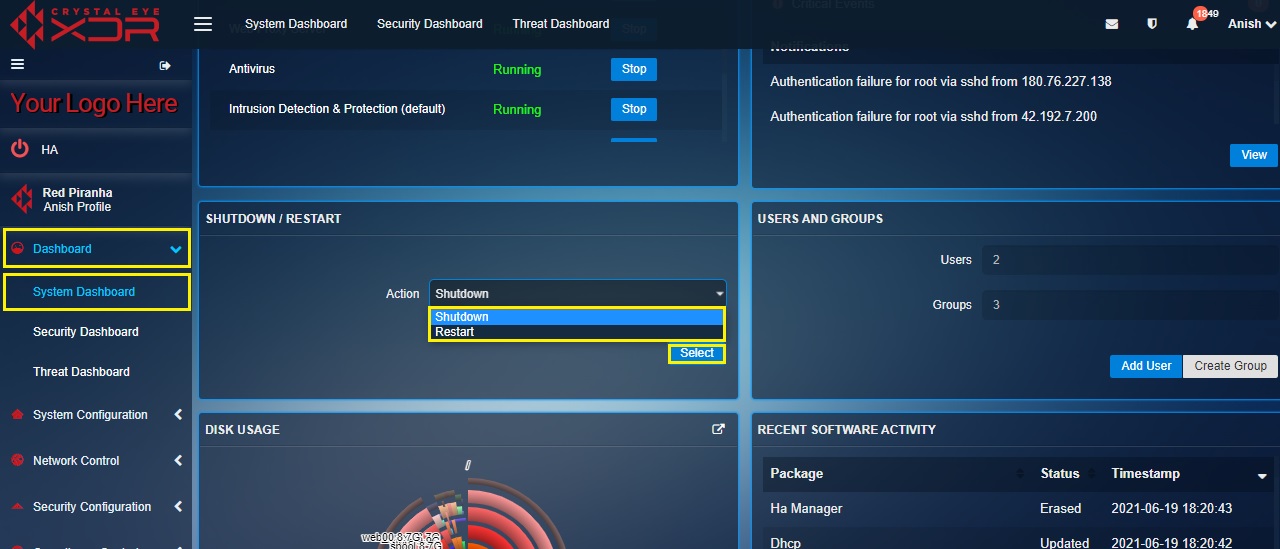
The graphic user interface allows administrators to either restart or shutdown the Crystal Eye XDR on-premise. The process of shutting down ensures that the unit is powered down and will not get back online unless it is switched on manually using the start button on the appliance itself. The CE XDR on-premise can also be restarted from the GUI and on initiating the restart process from the GUI the appliance goes through a complete shutdown process and then gets back in a few seconds. Both the Shutdown and Restart functionality is utilized during troubleshooting as well.
How to Shutdown and Restart the Crystal Eye appliance?
Step 1: In the Shutdown/Restart widget, select Shutdown or Restart from the Action dropdown and click the Select button.
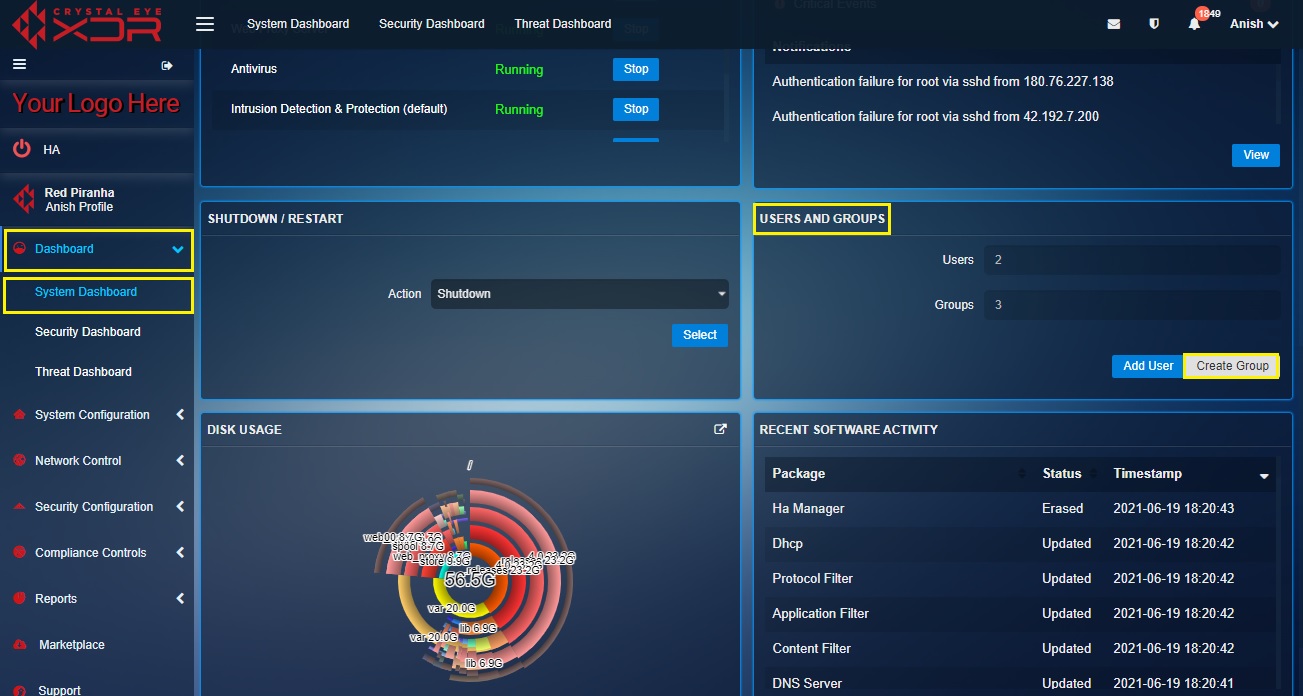
The Users & Groups widget can effectively be utilized to create new CE users and groups. The widget also shows the number of users and groups that have been created in the Crystal Eye XDR on-premise.
Various CE network defence policies can be applied to the users and groups in CE. All the new users created using this widget can be aligned to one or more groups. These groups can further be categorized by CE administrators to implement various Crystal Eye security policies.
Note: Users & Groups can also be created using the User Application and the Groups Application. However, the Users & Groups widget in the System Dashboard of the Crystal Eye appliance provides a short cut to create User & Groups.
Why Create Users & Groups on the Crystal Eye Appliance?
Policies in the Crystal Eye XDR on-premise are module-specific. Policies that apply to particular users or group of users are desirable if your appliance has multiple concurrent network connections.
While configuring network defense policies in the Crystal Eye XDR on-premise, an administrator will come across various scenarios where users and groups must be mentioned in order to effectively enforce policies.
Creating users on the Crystal Eye XDR on-premise becomes important while configuring authentication based content filter policies and authentication based web proxy policies.
SSL VPN can only be activated for the users who have been granted permission.
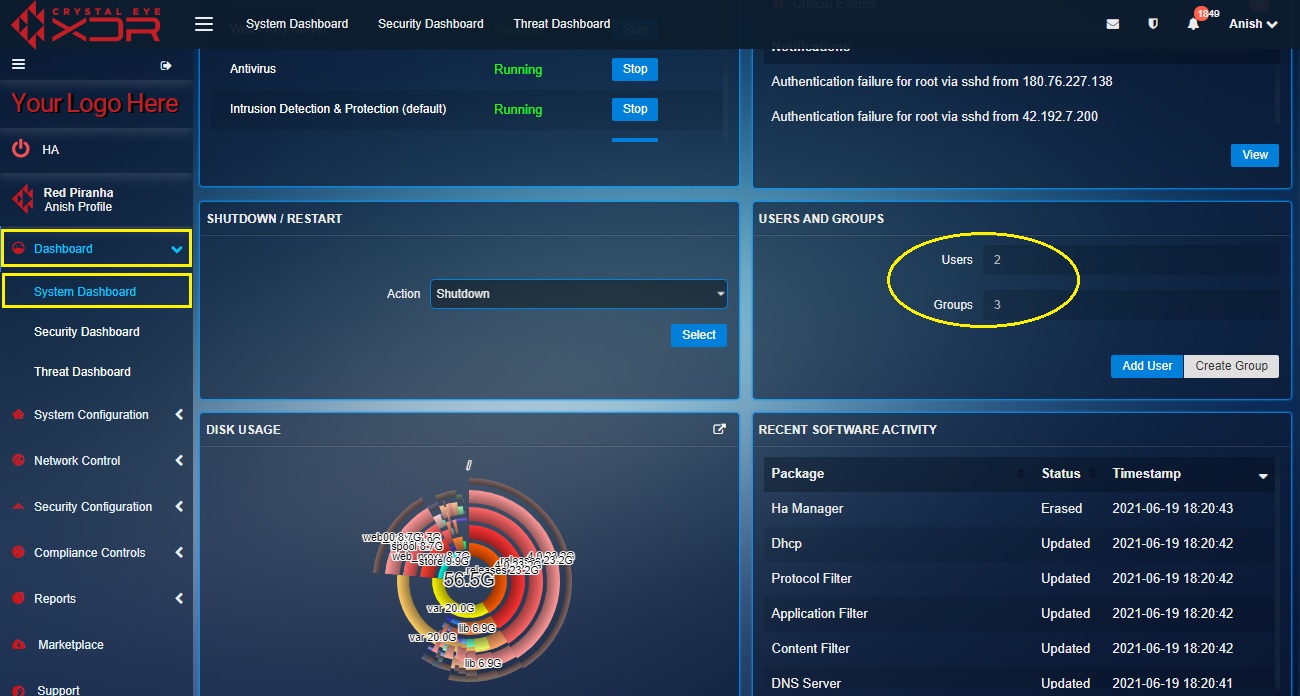
How to Know the Number of Users and Groups Created in the Crystal Eye XDR on-premise?
The number of users and groups created in the Crystal Eye XDR on-premise is highlighted in the widget screenshot below:
How to Create Groups Using the Users & Groups Widget?
Step 1: In the Users & Groups widget, click the Create Group button.
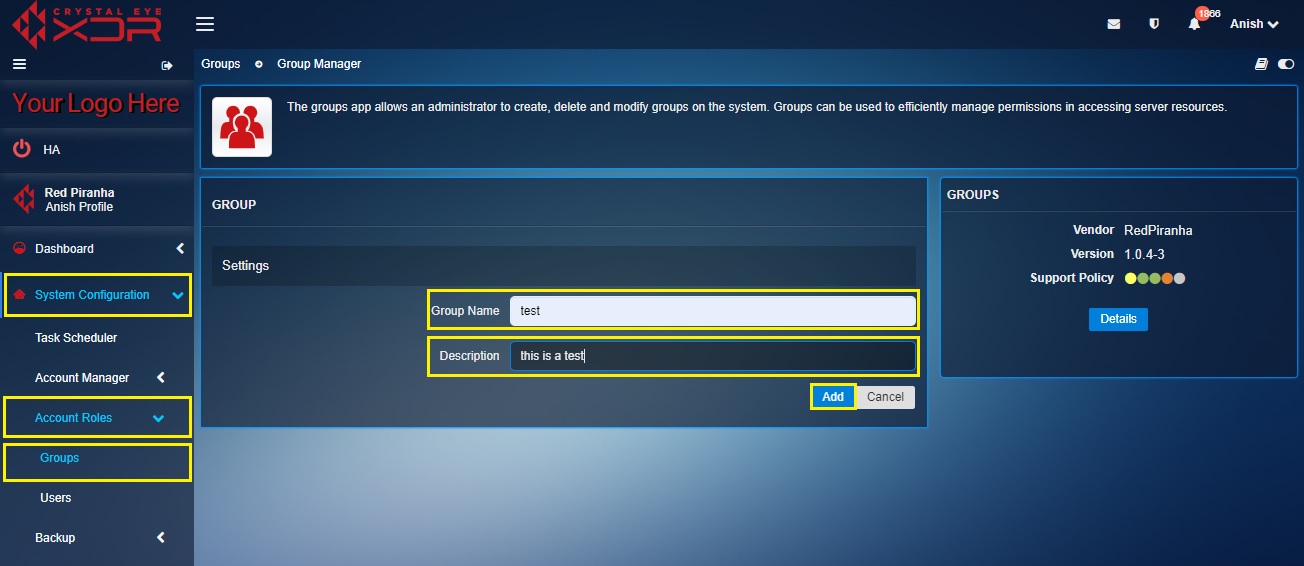
Step 2: You will now be directed to the Group Settings page of the Groups application. Enter the Group Name and Description in the textbox and click the Add button.
Step 3: You will now be directed to group page. Select the users that need to be added to the group and click the Update button.
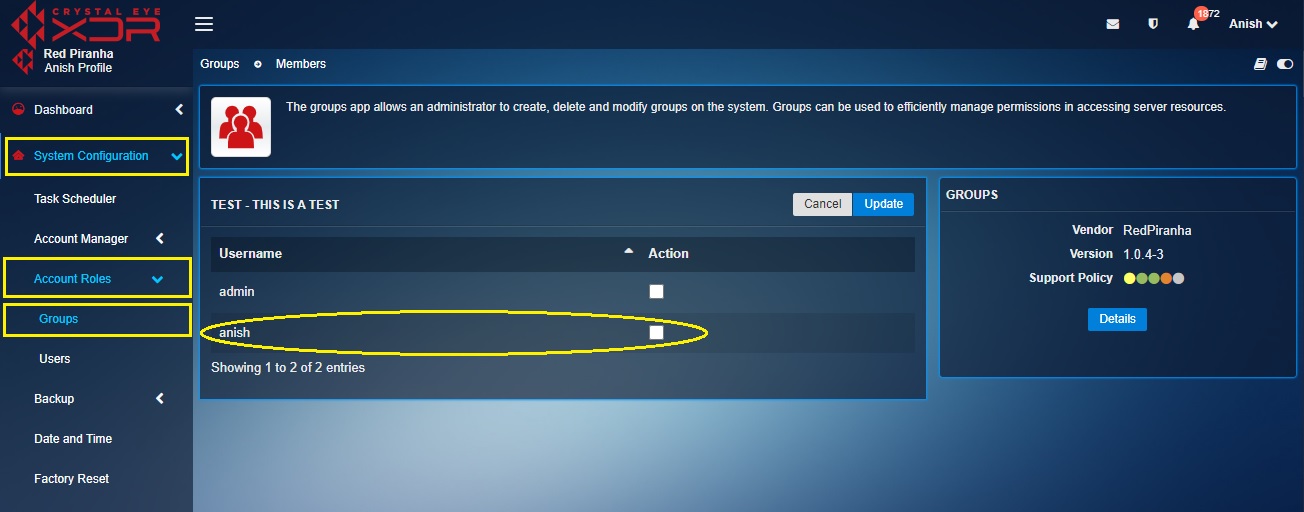
Note: In this case as mentioned in the screenshot above two users namely, Test and Test1 have been added to the group.
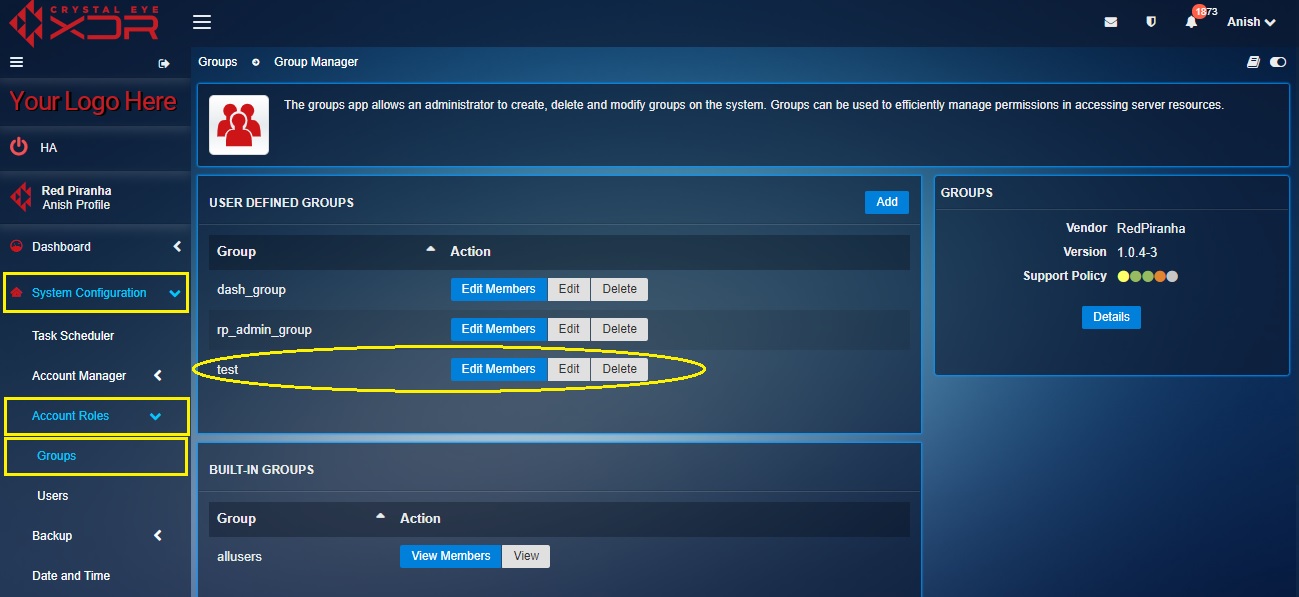
Step 4: You will now see the group name mentioned under the User Defined Groups section.
How to Add Users Using the Users & Groups Widget?
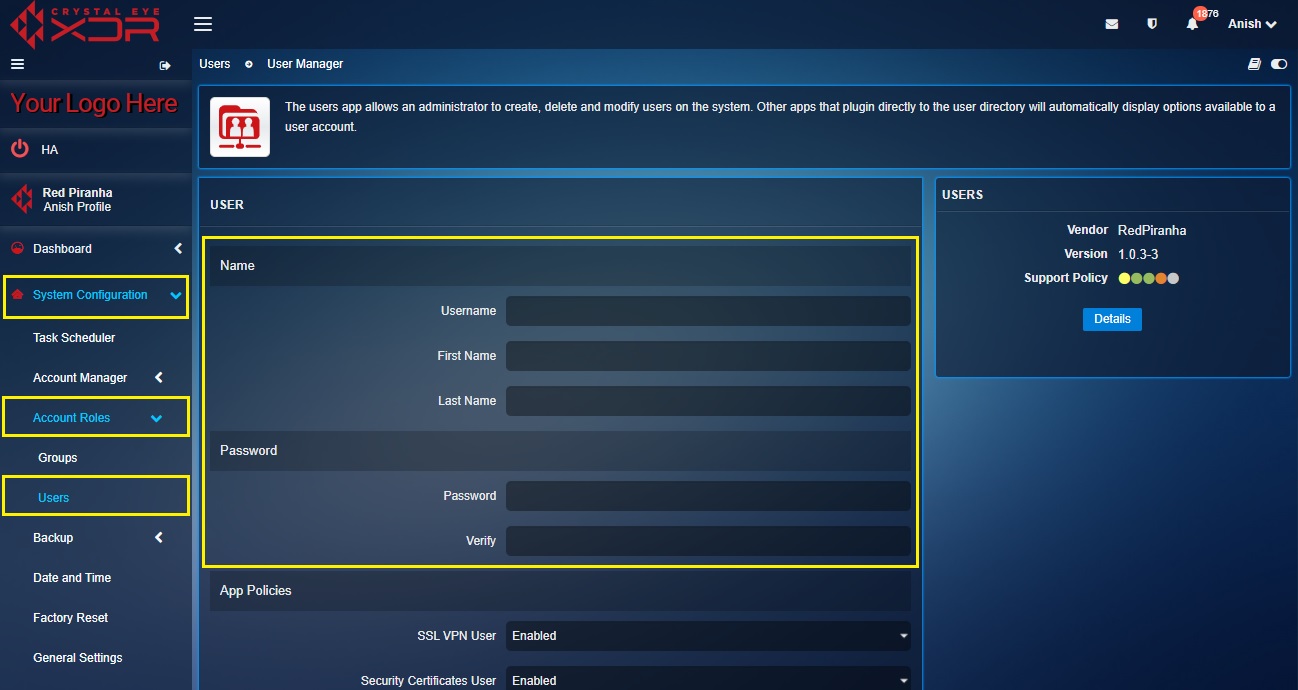
Step 1: In the Users & Groups widget, click the Add User button.

Step 2: You will now be directed to the User page. Enter the Name and Password.
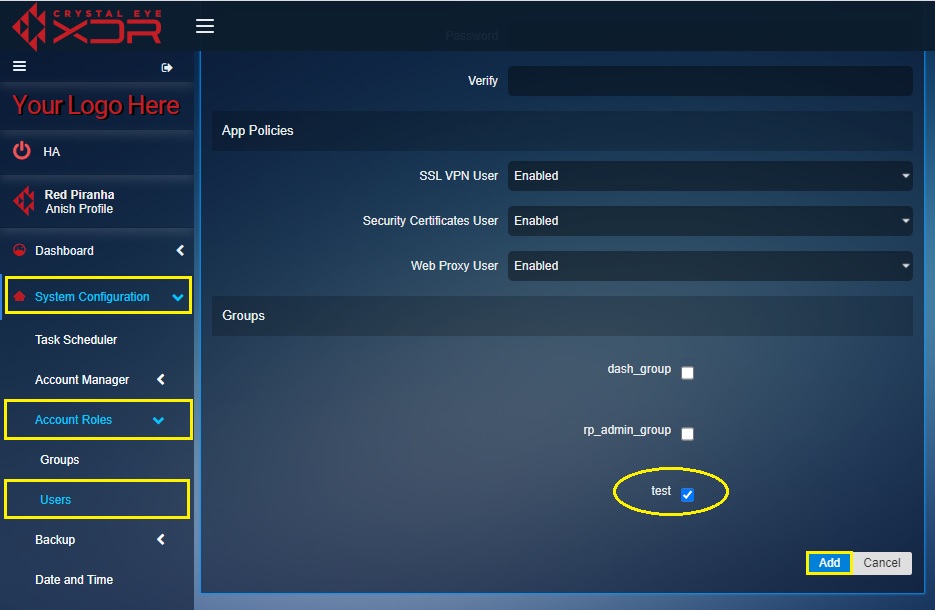
Step 3: Select the groups you want the user to be a part of in the Groups section and click the Add button.
The Disk Usage widget has a data analysis tool that helps the administrator to detect the source of wasted disk space. The analysis tool looks like a pie chart showing graphical representation of various components of Crystal Eye appliance’s hard disk that are being used by various data fragments.
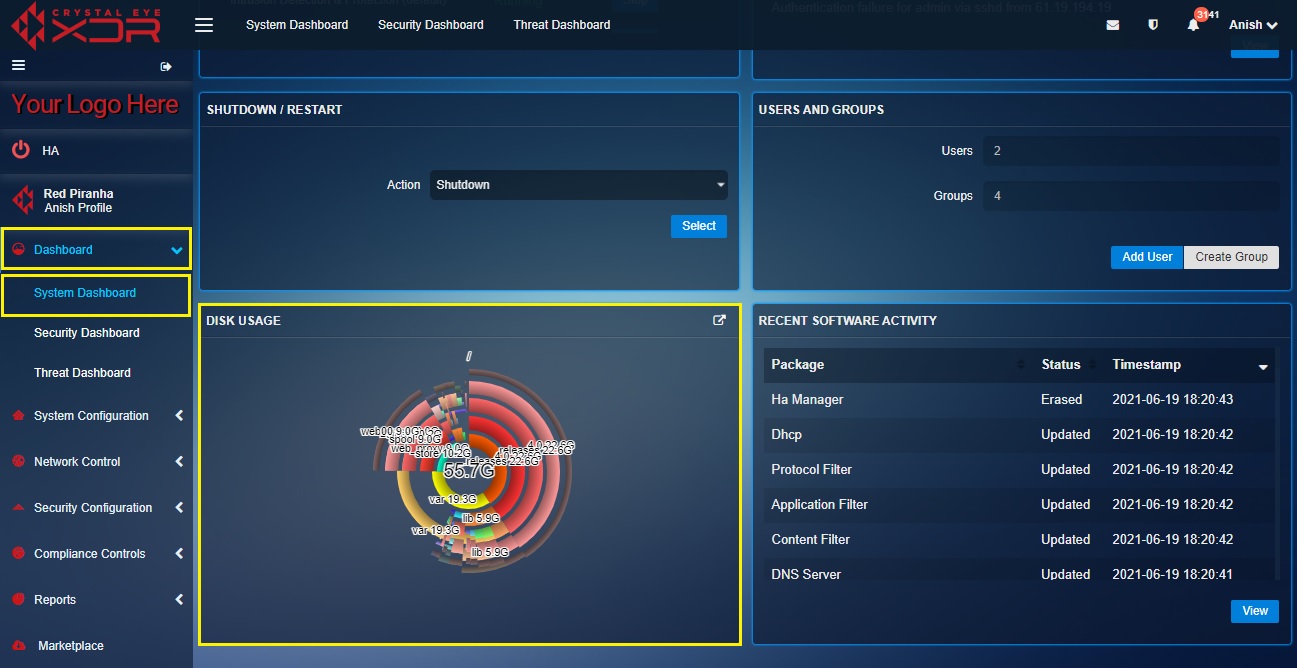
Note: The analysis tool provides a visual depiction of how the Crystal Eye disk is bifurcated in terms of space usage as shown in the screenshot below.
How to Gain Greater Insights about the Disk Usage Details of the Crystal Eye XDR on-premise?
The Disk Usage widget in the System Dashboard of the Crystal Eye appliance can be used to gain access to the Disk Usage application. This application has user friendly functionalities that help CE administrators to set maximum disk usage space and monitor the current disk space usage.
The following steps ensure that the CE administrator gains greater insights on the disk usage details of the Crystal Eye appliance.
Step 1: In the Disk Usage widget, click the link icon at the top-right corner of the widget.
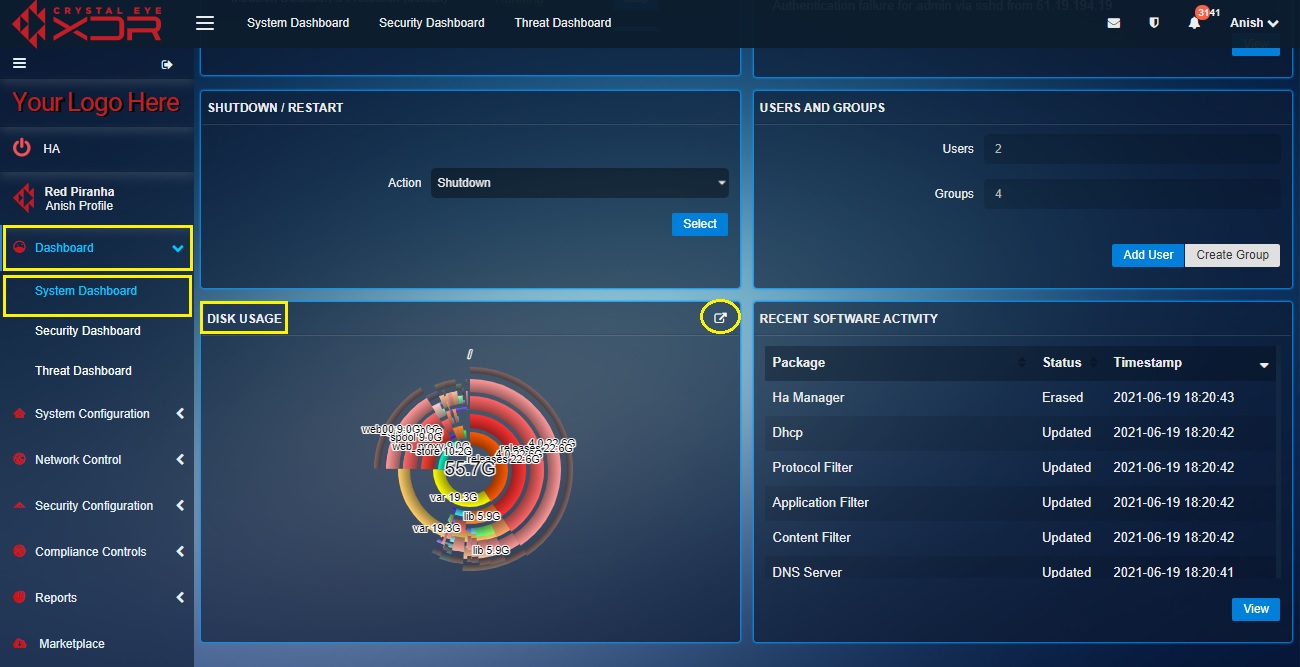
Note: Once you perform the above step, you will be directed to the Disk Usage application which is a part of the Reports category of the Crystal Eye XDR on-premise.
Step 2: You will now be directed to the Disk Usage application which is categorized under the Reports Category. Assign the Max disk usage (in percentage) under the Settings section.
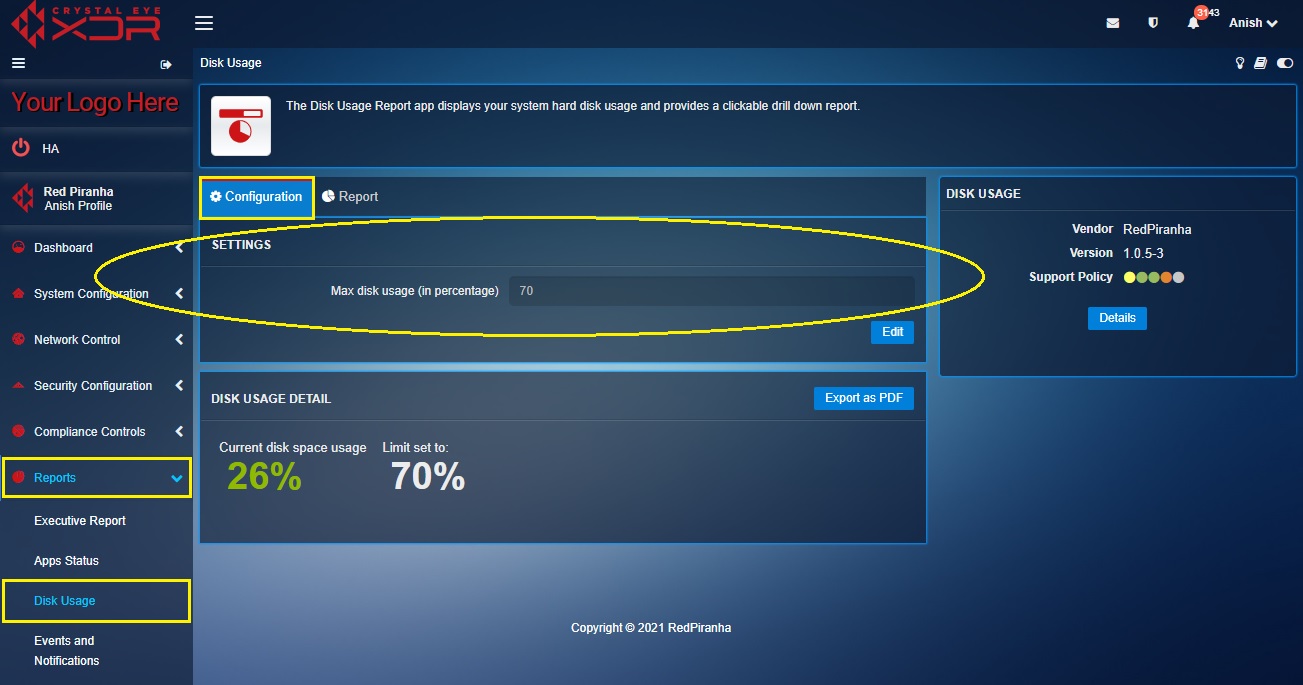
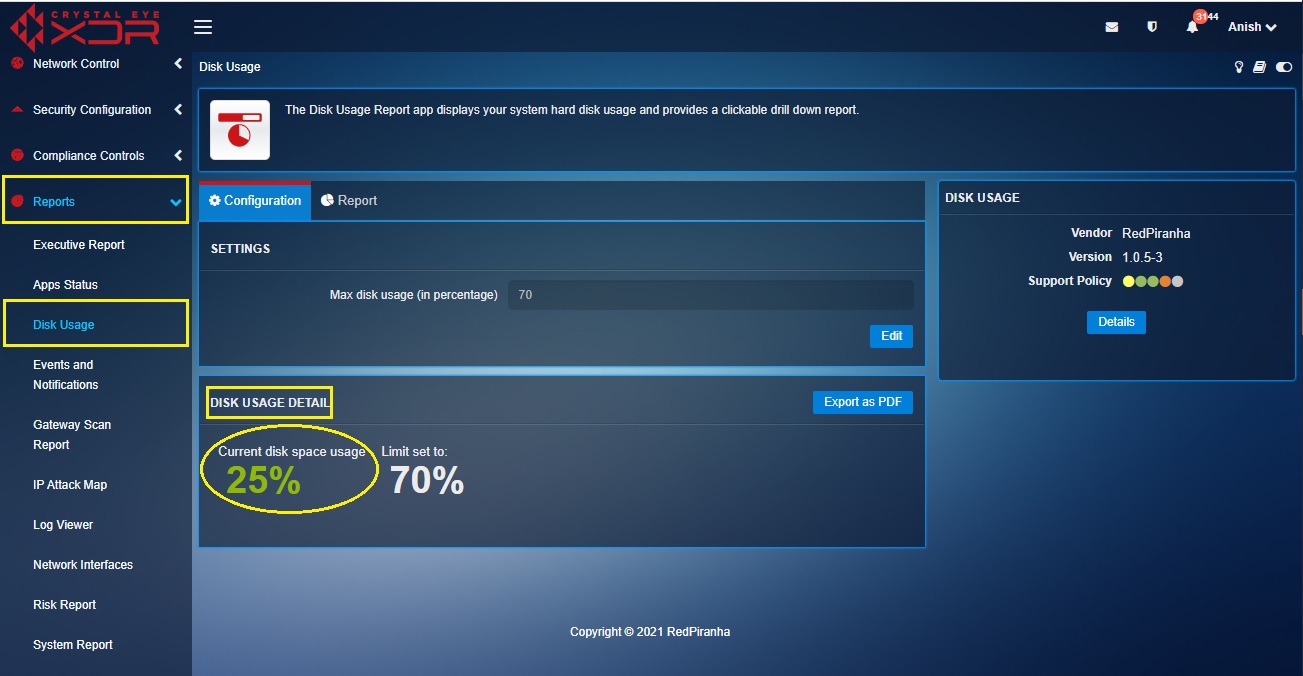
Step 3: Know the current disk space usage under the Disk Space Usage section.
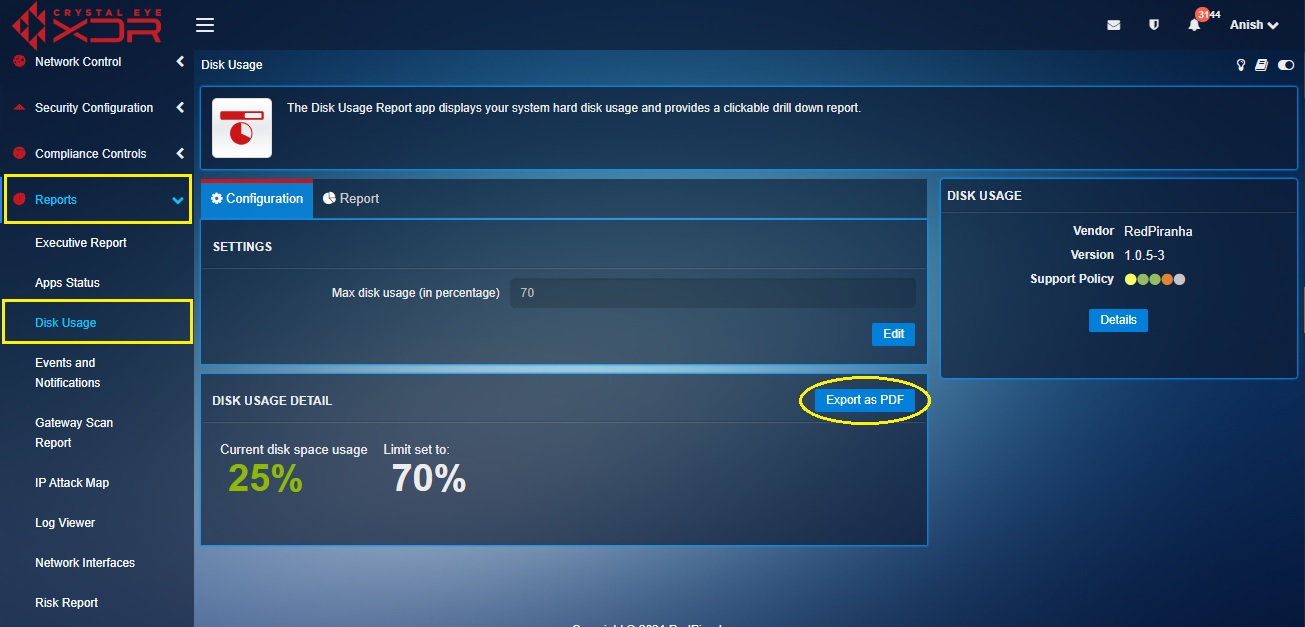
Step 4: Click the Export as PDF button to download a PDF report of the Disk Usage of the Crystal Eye XDR on-premise.
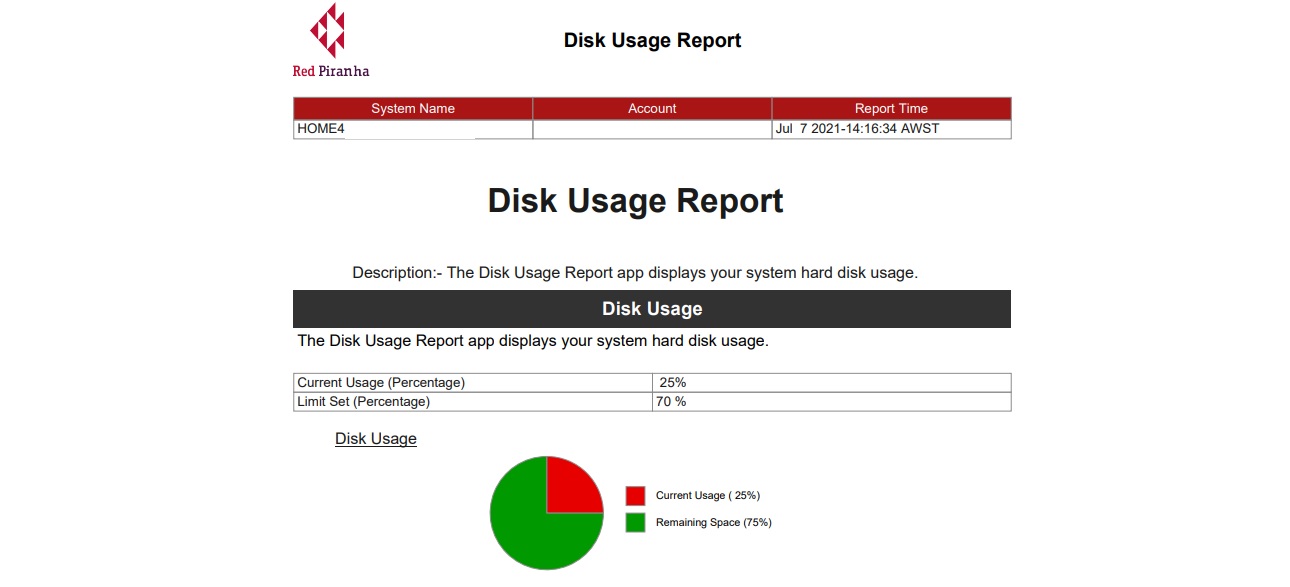
Note: The PDF Disk Usage Report shows the current disk usage percentage and the limit set for maximum disk (refer to the following screenshot).
The Recent Software Activity widget sheds light on the latest updates that have taken place in various applications installed in the Crystal Eye XDR on-premise. The widget also shows the date and time the update was initiated. Apart from the software update details the widget also provides more profound insights of the list of applications that were installed.
How to know the date and time a Crystal Eye XDR on-premise application was updated?
The Recent Software Activity widget has convenient features that detects the date and time on which a Crystal Eye XDR on-premise application was updated through Red Piranha’s service delivery network (SDN). If the Status column shows ‘Updated’ that means the application was updated recently and the date and time is shown in the Time column next to it. The highlighted portion of the screenshot below shows the time and date on which the CE application was updated.
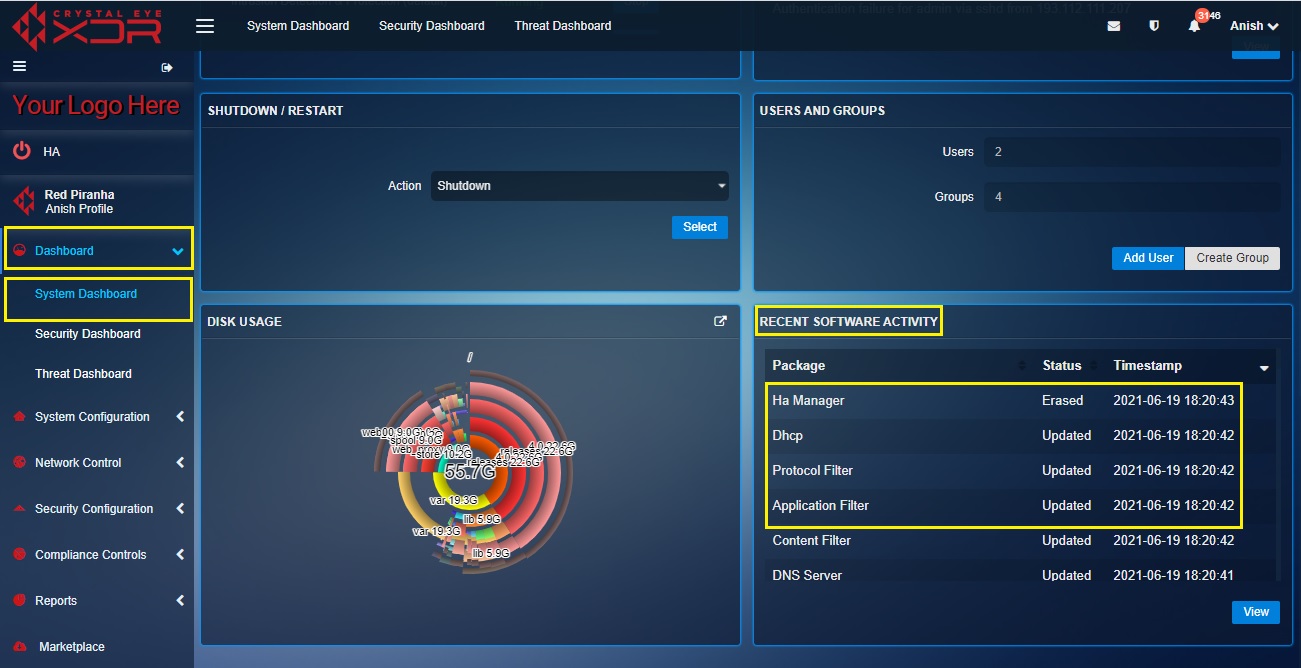
Note: Look out for the ‘Updated’ status message to know the recent updates as shown in the screenshot above.
How to know when was a particular application last installed in the Crystal Eye XDR on-premise?
The Recent Software Activity widget displays the date and time of all recent CE XDR on-premise application installs. Any recent install will have ‘Installed’ mentioned under the Status column. The highlighted portion of the screenshot below shows the time and date on which the application was installed.

Note: Look out for the ‘Installed’ status message to know the recent installs of Crystal Eye XDR on-premise applications in the screenshot above.