Events and Notifications
The primary functionality of the Events and Notifications application is to log various events generated in the Crystal Eye appliance on a real time basis. All the event types recorded/logged by Crystal Eye are categorized under three main categories namely, Informational Events, Warning Events and Critical Events. The information generated through these event types can be interpreted to effectively monitor various CE related processes.
The Events and Notifications application has a dedicated table that tracks, records and displays all the events that occurs in the Crystal Eye appliance. This table not just shows the Event Type but also describes it in detail. The screenshot below shows the Events and Notification table. The Description column elaborates on what exactly happened and the Event Type column stresses on the nature of the event. The Timestamp column shows the date and time at which the event occurred.
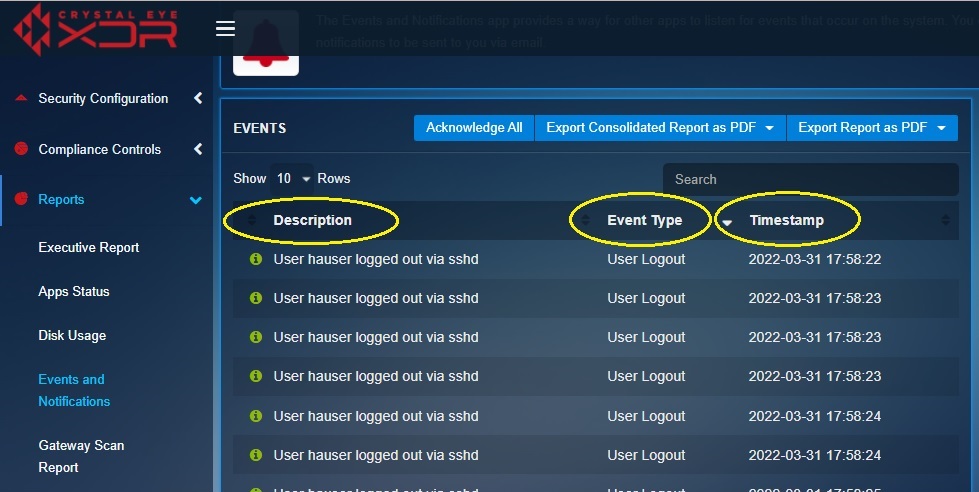
Note: The list of event types that are tracked and displayed by the events and notification application are Memory OOM Killed, User Logout, User Login, User Authentication Failed, Memory Swap High, System Firewall Panic, System Load High and Failed Login Attempt. The events that occurred in the past 24 hours can also be monitored in the Events – Last 24 Hours widget in the System Dashboard of the Crystal Eye appliance.
One of the most useful features of the Events and Notifications application is that it can be configured to send email notifications of the ongoing CE events to multiple email ids. However, the CE administrator has the choice to set the app to send these notifications on a real-time basis or on a daily basis.
The Events & Notifications application is installed by default and can be accessed from the left-hand navigation panel.
The Events and Notifications application page can be accessed through the Left-hand Navigation Menu and the System Dashboard of the Crystal Eye appliance.
1. Access the Events and Notifications application through the left-hand Navigation Menu
Left-hand Navigation Menu > Report > Events and Notifications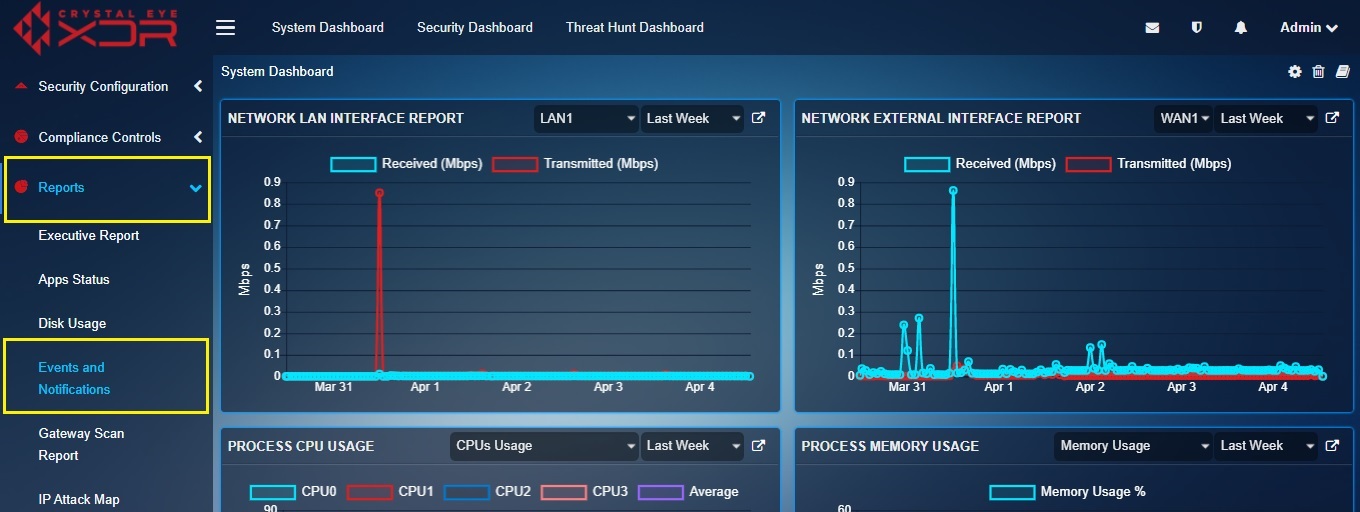
2. Access the Events and Notifications application through the System Dashboard
Click the Events and Notification application link icon on the top-right corner of the Events and Notifications application (refer to the circled icons in the screenshot below).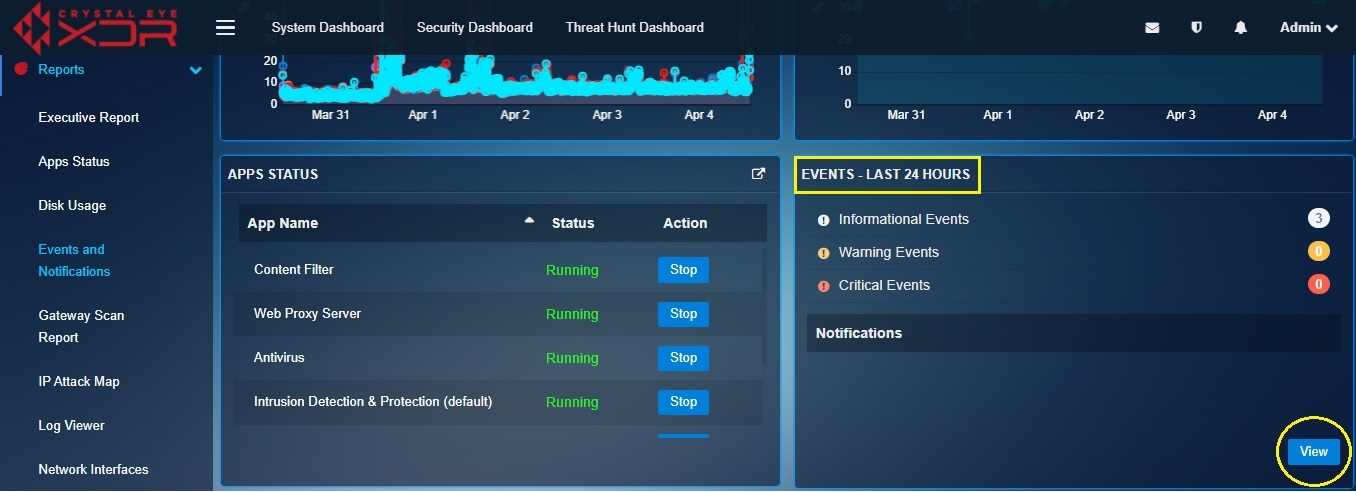
The Events and Notification application displays real-time information regarding various events that occurs in the Crystal Eye appliance. These events are categorized as informational events, warning events and critical events. All the events are listed in a tabular format shedding light on the event type, event description and timestamp. A CE administrator can segregate and filter the event types listed in the table as per its main categories i.e. informational events, warning events and critical events.
How to segregate event logs as per its main categories such as informational events, warning events and critical events?
Step 1: In the Events and Notifications application page, check/uncheck the tick box next to Show Info (Informational Events), Show Warning (Warning Events), Show Critical (Critical Events).
Note: By default, the Events and Notifications application shows event types relating to all events category. However, the default filter settings can be altered as mentioned above in step 1.
There can be instances when the CE administrator would want the Event Monitoring Status disabled. If this is disabled, then the Crystal Eye appliance will stop logging all the events. This can be done at a click of a button.
How to Enable/Disable Event Monitoring Status?
Step 1: In the Events and Notifications application, click the Settings Icon in the top-right corner of the page.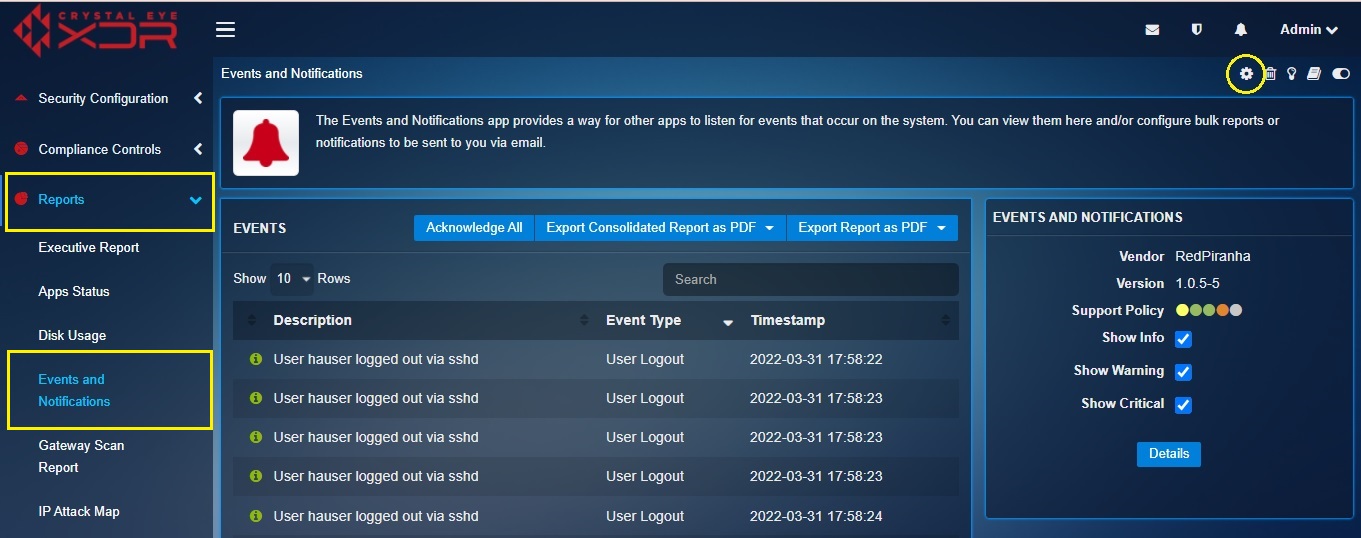
Step 2: You will now see the Settings page. Select Enable/Disable from the Event Monitoring Status dropdown.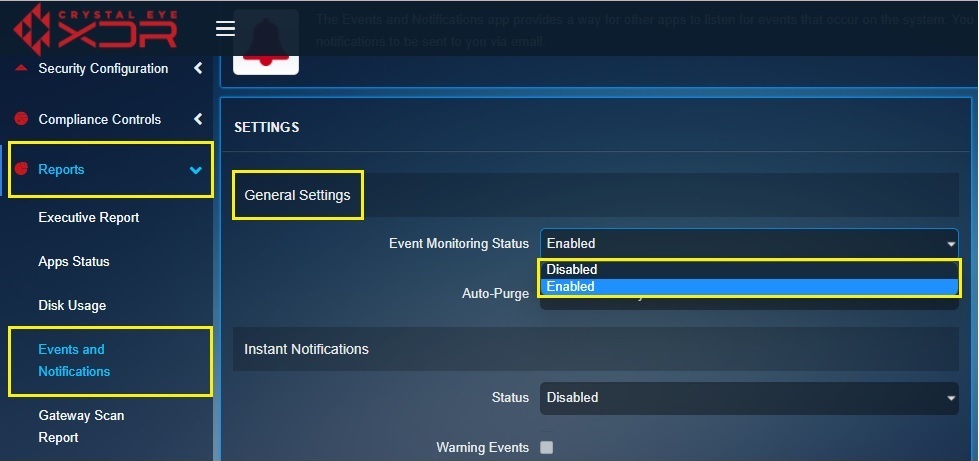
Step 3: Scroll down and click the Update button.
One of the most convenient features of the Events and Notifications application is that it can be configured to send email notifications of informational events, warning events and critical events that take place in the Crystal Eye appliance. Email notifications can also be set to be sent on a real-time basis or on a daily basis. CE administrators may find this feature useful as it helps to monitor the Crystal Eye appliance on a real-time basis and investigate incidents that occurred in the past. All in all, it helps to get a 360-degree view of all event types related to the Crystal Eye appliance in a convenient manner.
How to Receive Warning Events & Critical Events Notifications Via Emails on a Real-Time Basis?
Step 1: In the Events and Notifications application page, click the Settings Icon on the top-right corner of the page.
Step 2: You will now see the Settings page. Select Enable in the Status dropdown under the Instant Notification section.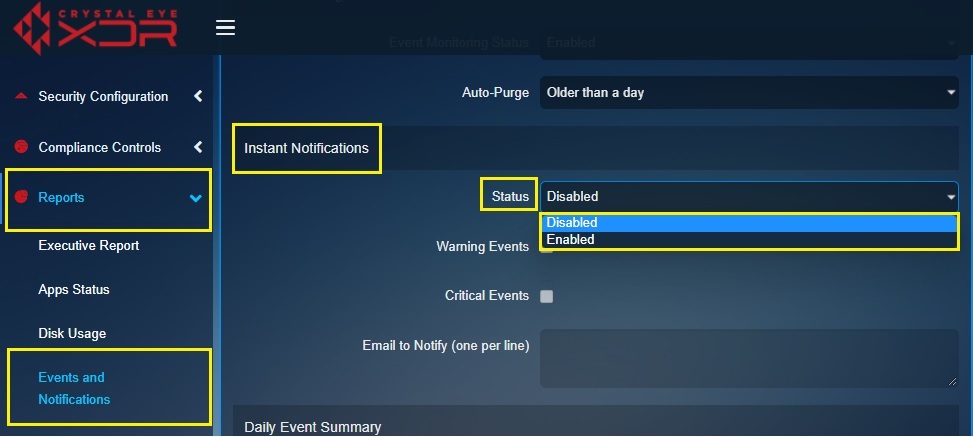
Step 3: Under the Instant Notification section check/uncheck the events category tick box that needs to be included in the email notification.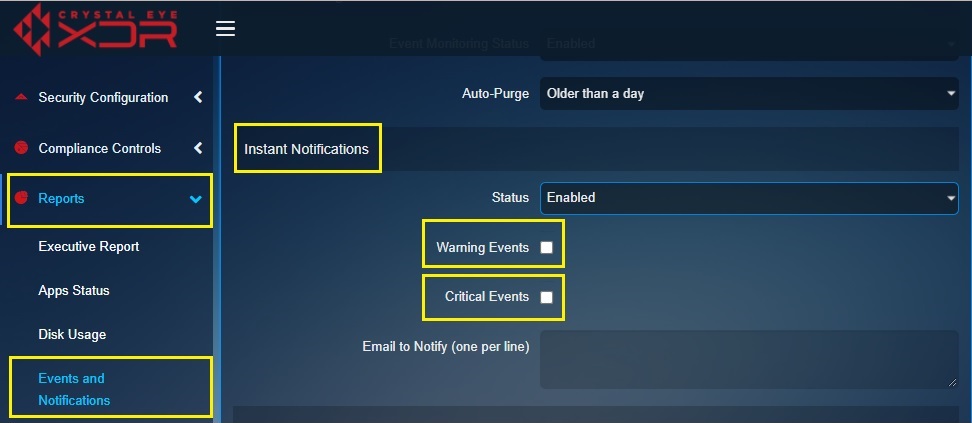
Note: The CE administrator can either select Warning Events or Critical Events or both to be included in the email notification.
Step 4: Enter the email address where the notification is to be sent.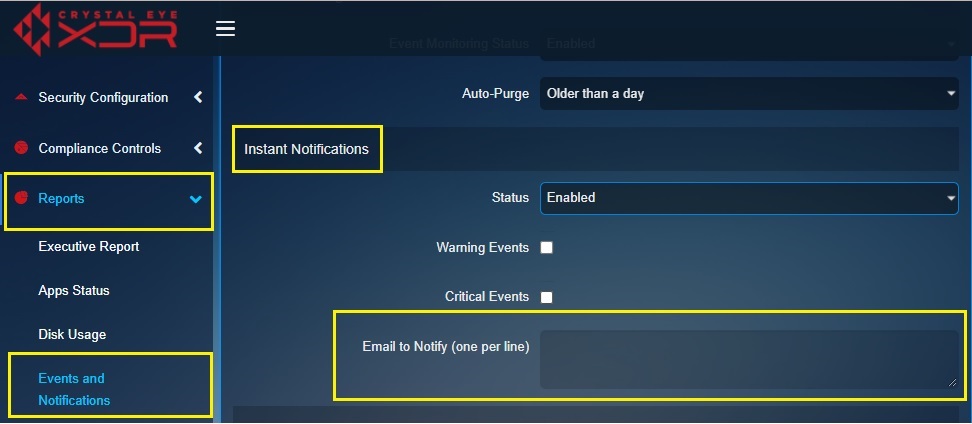
Note: Multiple email addresses can be added (one per line).
Step 5: Click the Update button.
How to Receive Informational Events, Warning Events and Critical Events Notification Via Emails on a Daily?
Step 1: In the Events and Notifications application page, click the Settings Icon on the top-right corner of the page.
Step 2: You will now see the Settings page. Select Enable in the Status dropdown under the Daily Event Summary section.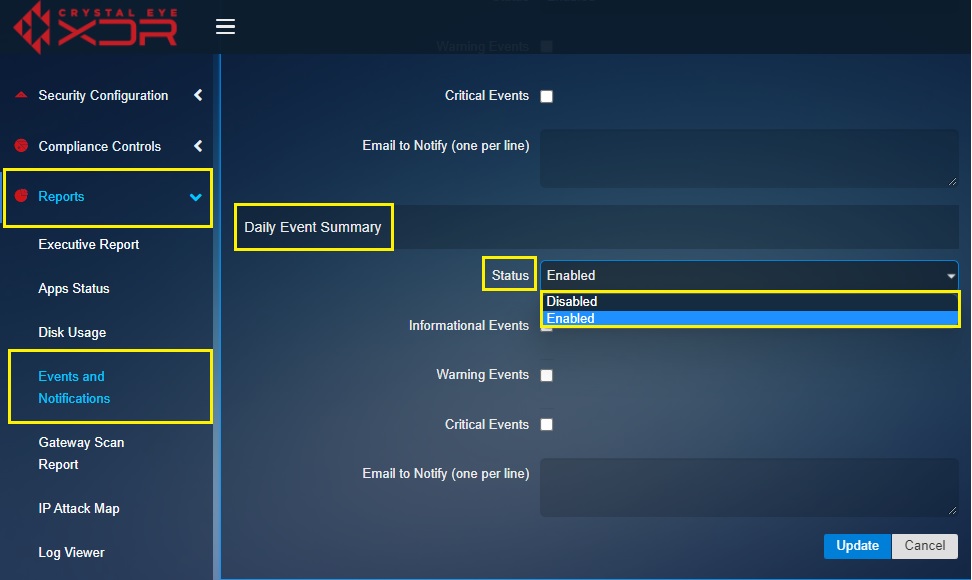
Step 3: Under the Daily Event Summary section, check/uncheck the events category tick box that needs to be included in the email notification.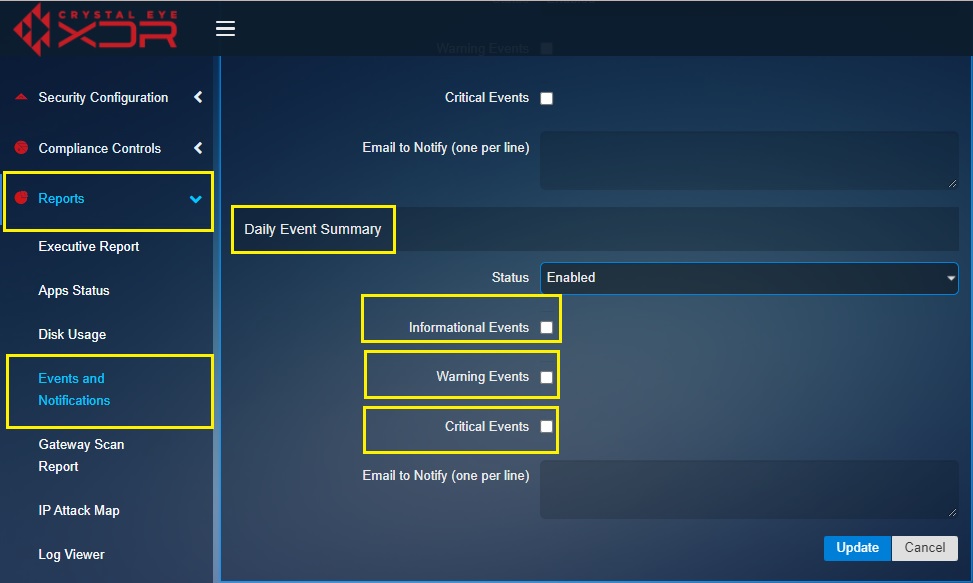
Note: The CE administrator can either select Informational Events, Warning Events or Critical Events or both to be included in the email notification.
Step 4: Enter the email address where the notification is to be sent.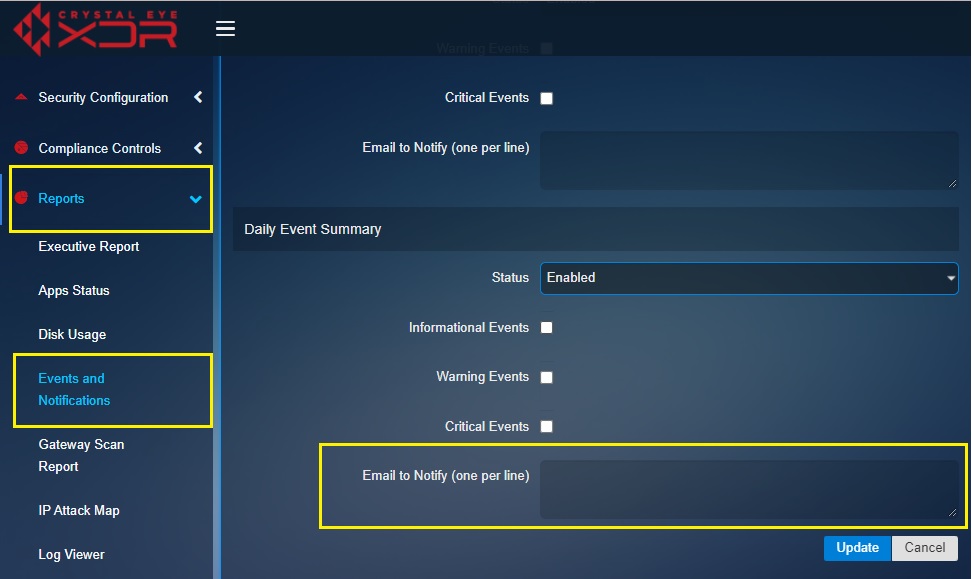
Note: Multiple email address can be added (one per line)
Step 5: Click the Update button.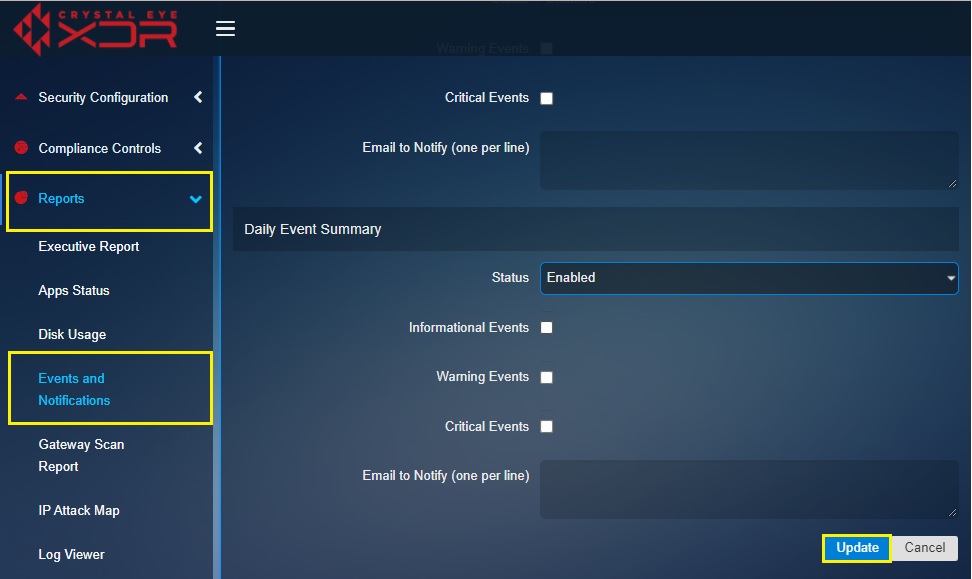
The Events and Notifications application displays all the events in a tabular format with advanced filtering capabilities that can be used to categorize various event types.
One of the major reasons for having events and notifications displayed on a real-time basis is that it facilitates continuous monitoring of various event types that occurs in the Crystal Eye appliance. In-fact these events must just not be monitored but remedial actions must be taken on a timely basis based on the events that has been flagged. The Acknowledge All button is used to acknowledge all events in the table which also leads to the clearance of these events from the alert notification counter at the top-right corner of the page. This mechanism is explained below.
All the events that are displayed in a tabular format in the application are also parallelly populated at the alert notification counter located at the top-right corner of the page (refer to the bell icon in the screenshot below).
How to acknowledge all events in the events and notifications table?
Step 1: In the screenshot below, you will notice that the bell icon (circled in red) has the number 5 mentioned over it. This means that there are 5 events in the table that have not been acknowledged yet by the CE administrator.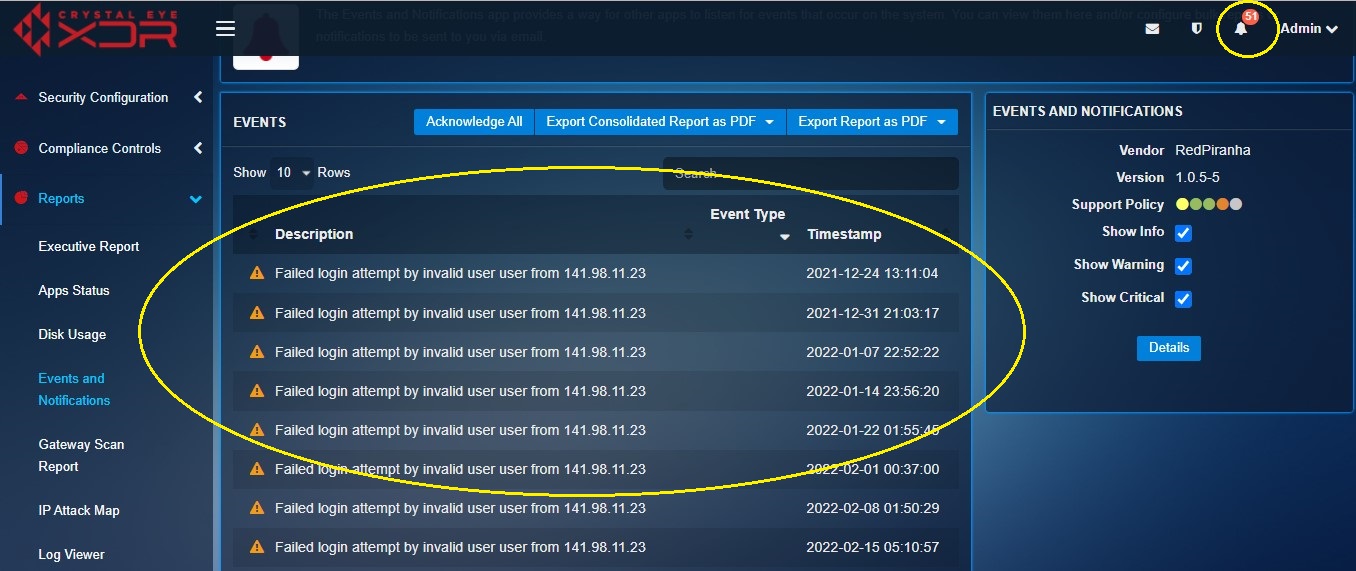
Step 2: In the Events and Notification application page, click the Acknowledge All button.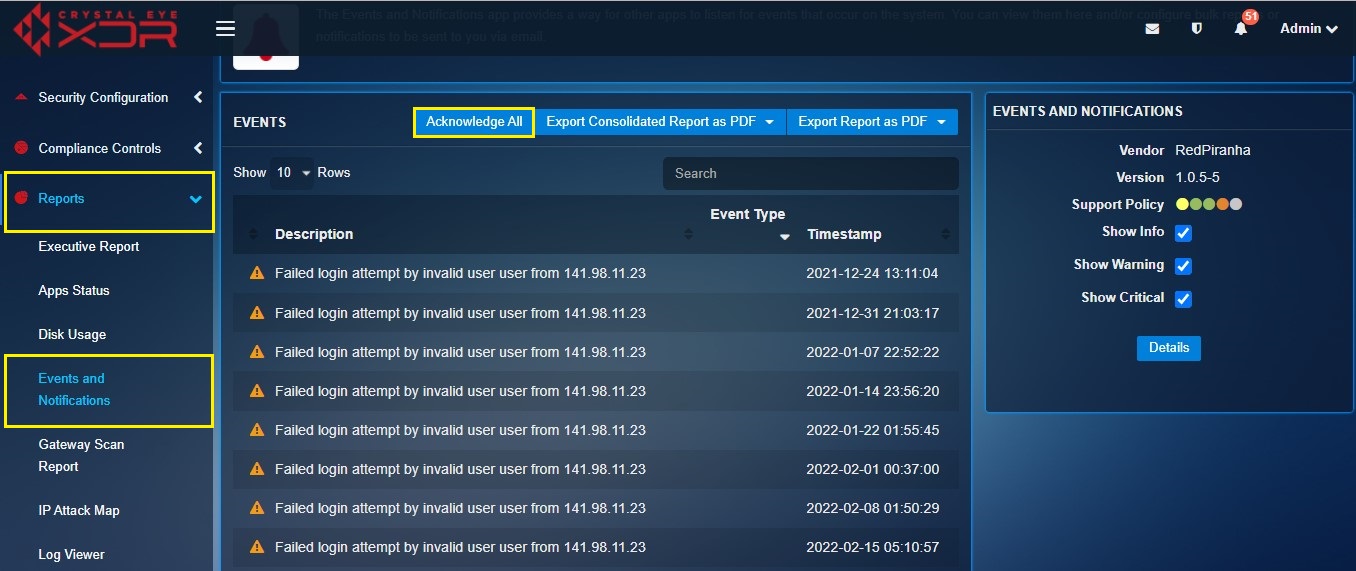
Step 3: You will now see a pop-up. Click the Confirm button.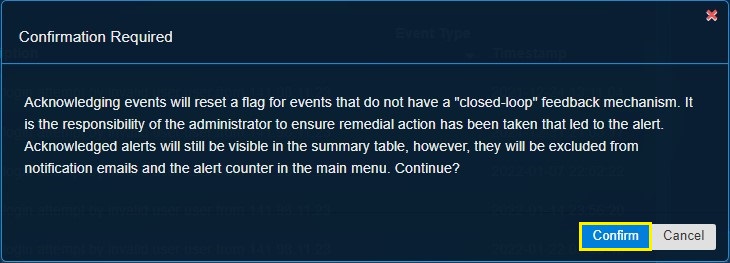
Note: Once you have hit the confirm button you will notice that the number of alerts mentioned over the bell icon would be erased.
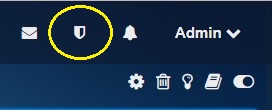
The Events and Notifications application channelizes ways through which a CE administrator can export PDF events reports. There are two types of reports, the first type shows all the event types in a pie chart and the second type shows all the events in a tabular format (the table would mention the event type with its timestamp and description).
How to view & export PDF reports that show all event types of the CE appliance in a pie-chart format?
Step 1: In the Events and Notifications application page, click the Export Consolidated Report as PDF dropdown button and select the time period for which the report is required.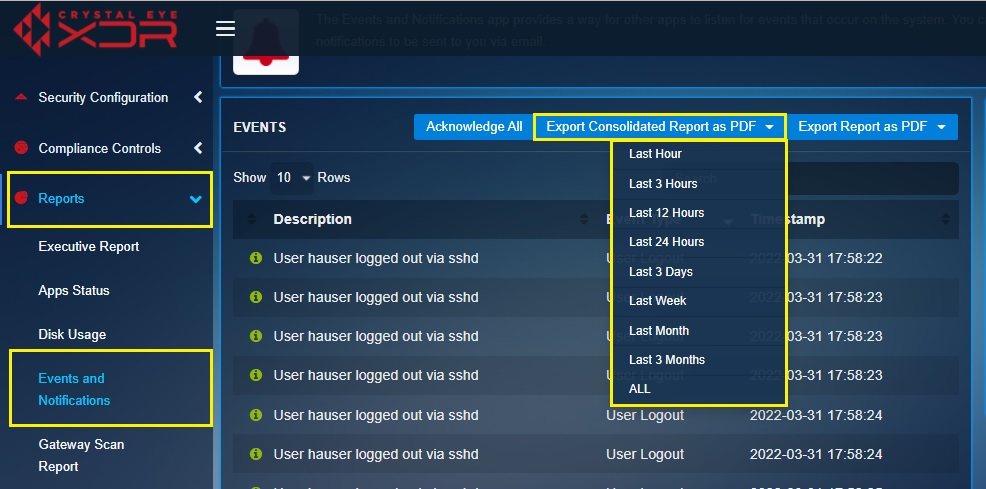
Note: The report time period here is selected as 3 days.
Step 2: You will now see the PDF report that shows all event types of the CE appliance in pie-chart format. 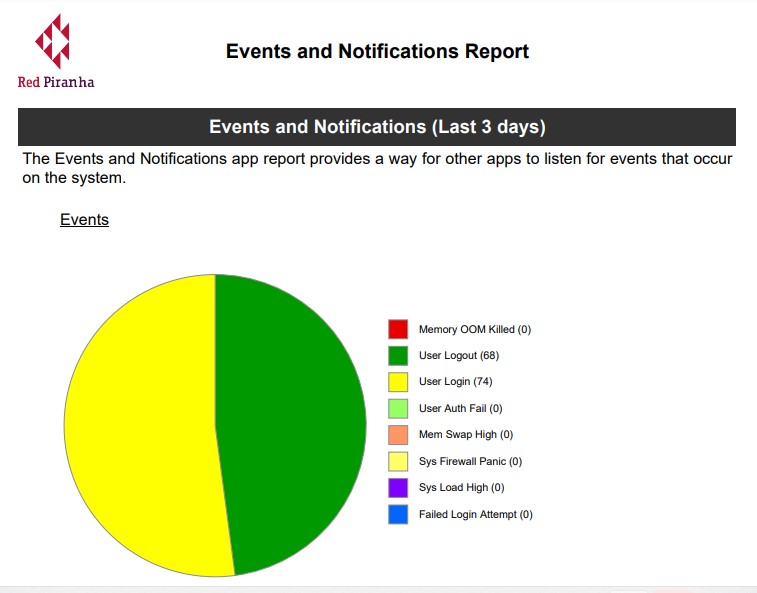
Note: As you can see there are 8 event types that are shown in the pie-chart namely, Memory OOM Killed, User Logout, User Login, User Authentication Failed, Memory Swap High, System Firewall Panic, System Load High and Failed Login Attempt.
How to view & export PDF reports that show all event types of the CE appliance in a tabular format?
Step 1: In the Events and Notifications application page, click the Export Report as PDF button and select the time period for which the report is required.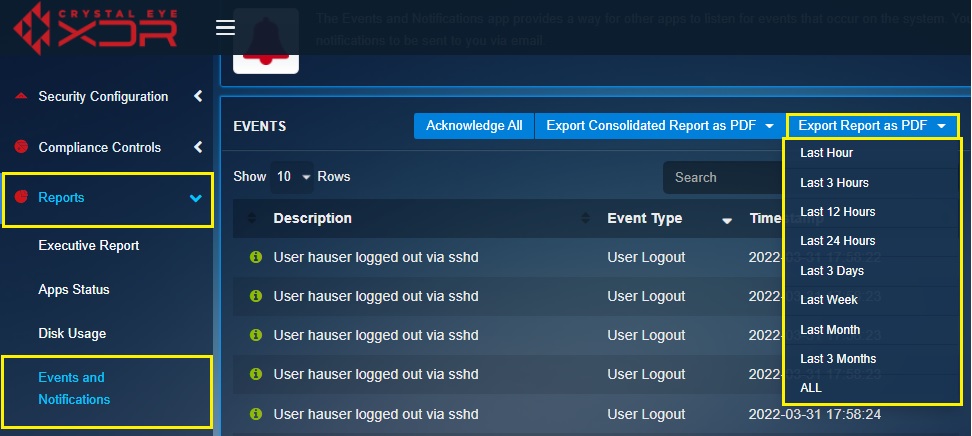
Note: The report time period here is selected as 3 days.
Step 2: You will now see the PDF report that shows all event types of the CE appliance in the tabular format.