Security Dashboard
The Security Dashboard displays various security-related data gathered by the Crystal Eye appliance. The information is depicted through widgets making it convenient for Crystal Eye administrators to have a 360 degree view of all the aspects related to the network interface. The powerful features of the security dashboard have the capability to display an array of security-related data that could play a vital role in averting a major cyber-attack on a real-time basis.
One of the most convenient features of the security dashboard is that it can be customised as per specific monitoring requirements. The CE administrator has the option to design the layout of the security dashboard and also choose which widget to be displayed.
By default CE displays six important security dashboard widgets namely, the IP Attack Map, Scan Summary, IDS/IPS Alerts Statistics, Top IPs (that have downloaded and uploaded the most), Network Map (hub and spoke widget), Top Protocols Graph (in terms of traffic size). Each part named above provides a snippet of security related data and is also linked with the relevant CE application from where it draws network security related data.
In addition to these, there are other security widget’s that the CE administrator can choose to display in the security dashboard. The widgets that are not displayed in the security dashboard and can be explicitly selected to be a part of it are, Antivirus Database Updates, IDS/IPS Events, AI Analysis Timelines, Top Users, Top Device Types, Top External IPs, Top Traffic Classification, Uptime and RAID Summary.
The IP Attack Map section of the Security Dashboard portrays unmatched capabilities in providing a base view of all attacks originating from various IP addresses targeted towards Crystal Eye networks.
There are six major security related indicators that are displayed in the IP attack map section of the CE Security Dashboard: 
Crystal Eye appliance has an in-built defensive system called ‘Forcefield’ that bans IP addresses in case the authentication failure threshold is surpassed. The Banned IPs table shows the time and date on which the IP address was banned providing deeper insights of possible failed breaches. Crystal Eye administrators can whitelist the banned IP addresses as well.
The following screenshot shows the Banned IPs Table: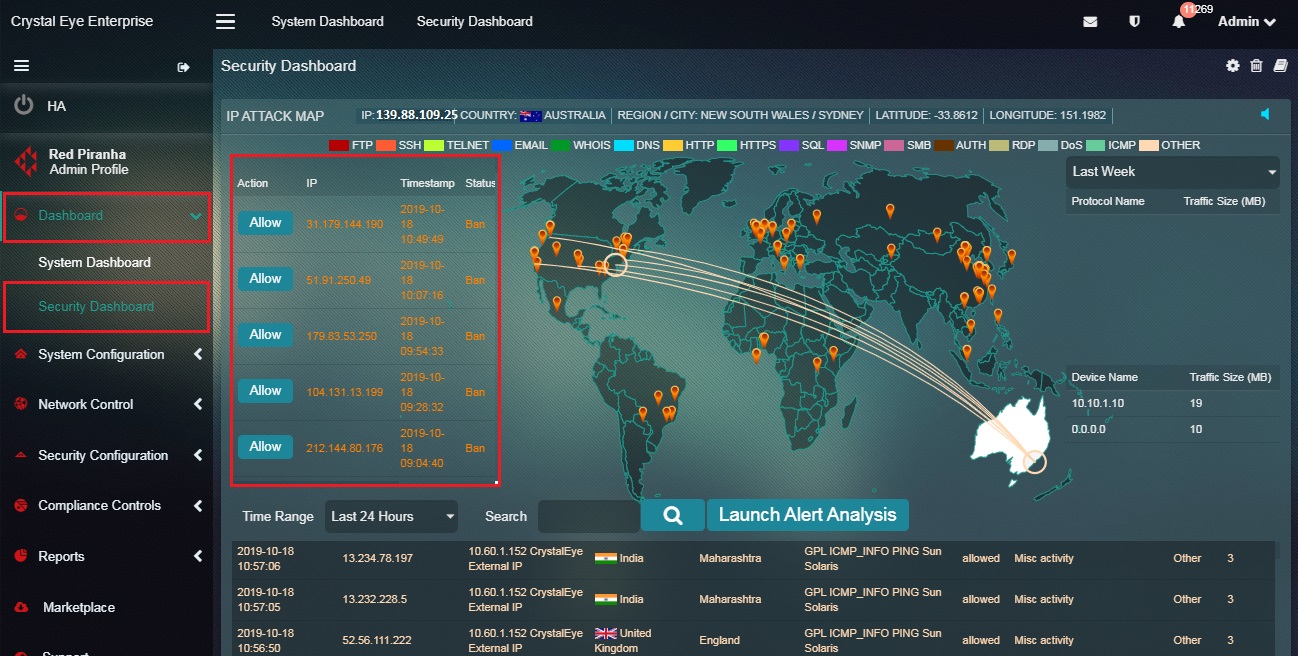
Note: The Banned IPs Table can also be viewed in the IP Attack Map application. The banned IPs can also be allowed (whitelisted) from this application. A PDF report showing pie charts of the number of IP addresses banned and unbanned can also be obtained under the Banned IPs Logs Report section of the Forcefield application. The pie chart also shows the top 10 countries from where the IP addresses were banned.
How to Allow/Whitelist an IP Address Banned by Crystal Eye’s Forcefield?
Step 1: In the Security Dashboard, click the Allow button next to the IP address that needs to be whitelisted in the Banned IPs Table. 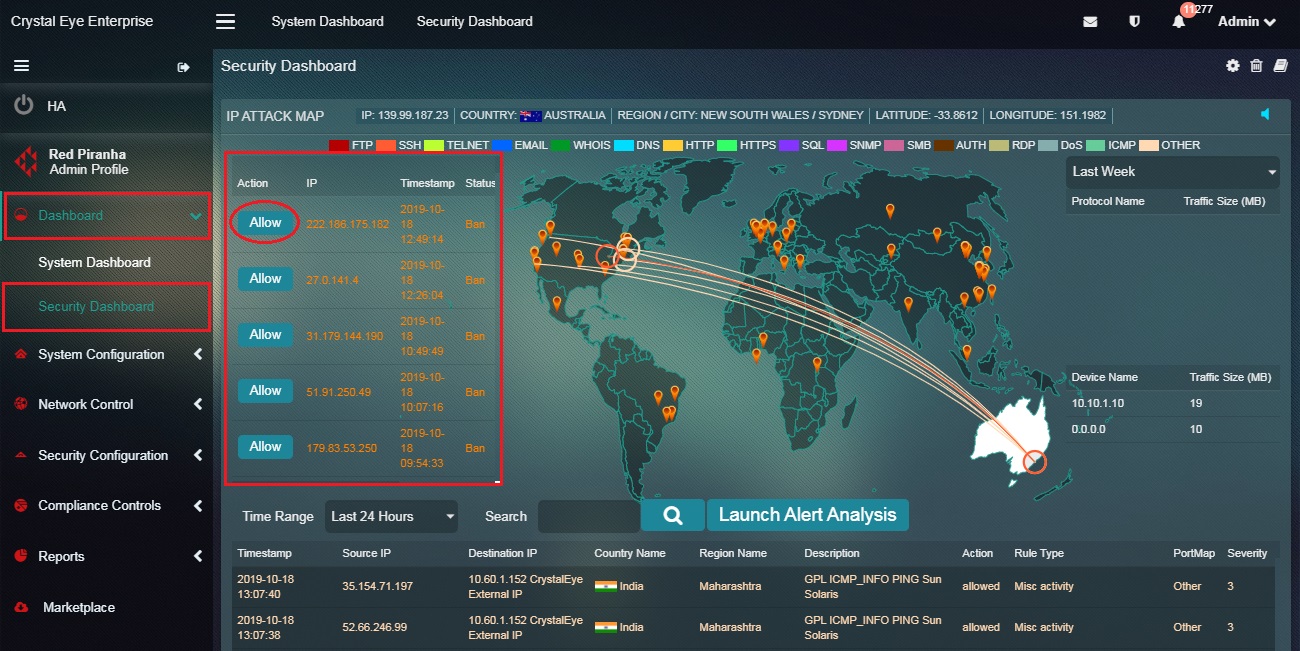
Note: You will also notice that the banned IP address is erased from the Banned IP Logs Reports in the Forcefield application.
This part of the IP attack map provides specific inputs on the different types of attacks targeted towards Crystal Eye networks. These are Intrusion Detection and Intrusion Protection (IDS/IPS) Alerts. The strings of attacks as shown in the screenshot below are colour coded to specify different protocols used to execute the attacks. ![]()
Note: The Real Time Attack Tracker can also be viewed in the IP Attack Map application. The banned IPs can also be allowed (whitelisted) from the application.
Some of the attack protocols that are detected and displayed here are FTP, SSH, TELNET, EMAIL, WHOIS, DNS, HTTP, HTTPS, SQL, SNMP, SMB, AUTH, RDP, DoS, and ICMP. If the attack protocols are different from the ones mentioned above then it would be recorded under ‘others’.
Each IDS/IPS alert denoted in the world map has a corresponding effect on the Alert table. This table shows the date/time the attack was initiated, the source IP, destination IP, country (from where the attack originated), region name, description of the attack, severity etc.
The traffic size or the size of the data transferred using a particular protocol is detected by the Crystal Eye appliance and is measured in mega bytes and is displayed here in the Protocol Traffic Size Indicator table. The standard unit of measurement used to measure the Protocol Traffic Size is Megabytes (MB).
Note: The Protocol Traffic Size Indicator table can also be viewed in the IP Attack Map application.
This table shows the device name (as mapped with CE) and the amount of data that it had received and sent over a period of time. The Device Traffic Size is measured in Megabytes (MB).
Note: The Device Traffic Size table can also be viewed in the IP Attack Map application.
This Alert Report displays attack specific data also known as IDS/IPS alerts generated on a real-time basis. These attacks and the protocols involved are visually depicted in the Real Time Attack Tracker mentioned above. When an attack is initiated, the origin of the attack and the target CE network is visually depicted in the Real Time Attack Tracker. The Crystal Eye administrator can also view elaborated details of the attack such as the source IP, destination IP, country (from where the attack originated), region name, description of the attack, severity etc in the Alert Report.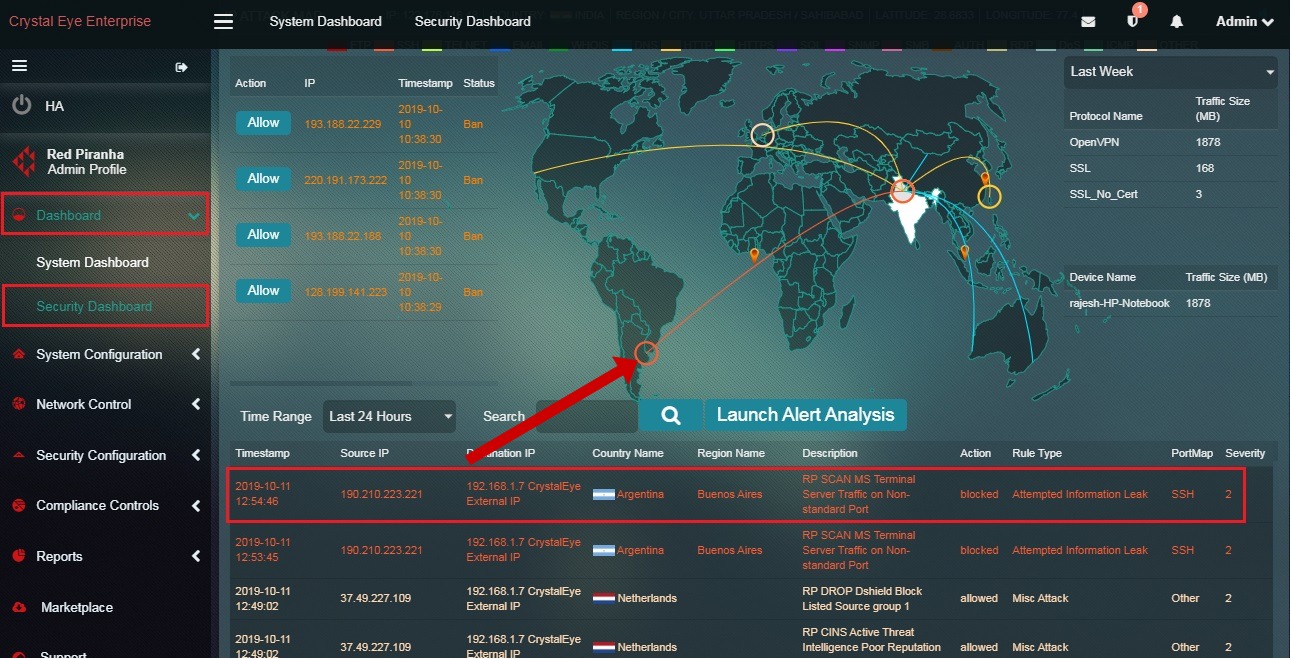
The above screenshot depicts that there was an attack that originated from Argentina and was targeted towards a network secured with Crystal Eye in India. The attack is denoted in the map and its corresponding details are also mentioned in the Alert Report.
Upon clicking a particular IDS/IPS alert the Crystal Eye administrator can view alert details, escalate an attack alert to Red Piranha’s Security Operation’s Team, and view the IDS/IPS rules that triggered the alert.
Note: The IDS/IPS Alerts Report can also be viewed in the IP Attack Map application and the IDS/IPS Alerts application.
What is Alert Analysis? What are the various ways IDS/IPS alerts can be analysed?
The Crystal Eye appliance displays various real-time alerts that can be viewed and analysed. The analysis process includes viewing the IDS/IPS Alerts and the rules that are triggering these alerts. The real-time alert pops-up in the alerts report and is triggered by rules which can be converted to pass, drop, or reject. If a rule is triggering too many false positives then the Crystal Eye administrator can also disable those rules. As a part of an elaborated alert analysis mechanism the CE administrator also has the leverage to escalate an alert attack to Red Piranha’s security operations centre team.
We have discussed the various ways to analyse IDS/IPS alerts below (refer to the ‘how tos’ below):
- How to view IDS/IPS alert details and the rules that triggers the IDS/IPS alert?
- How to convert the IDS/IPS rules to Drop, Pass or Alert after it triggers an attack alert?
- How to disable a particular IDS/IPS rule that triggered an IDS/IPS alert?
- How to escalate an attack alert to Red Piranha’s security operations centre team for analysis?
How to view IDS/IPS alert details and the rules that triggers the IDS/IPS alert?
Step 1: In the Security Dashboard, click any of the IDS/IPS alerts in the Alert Report section.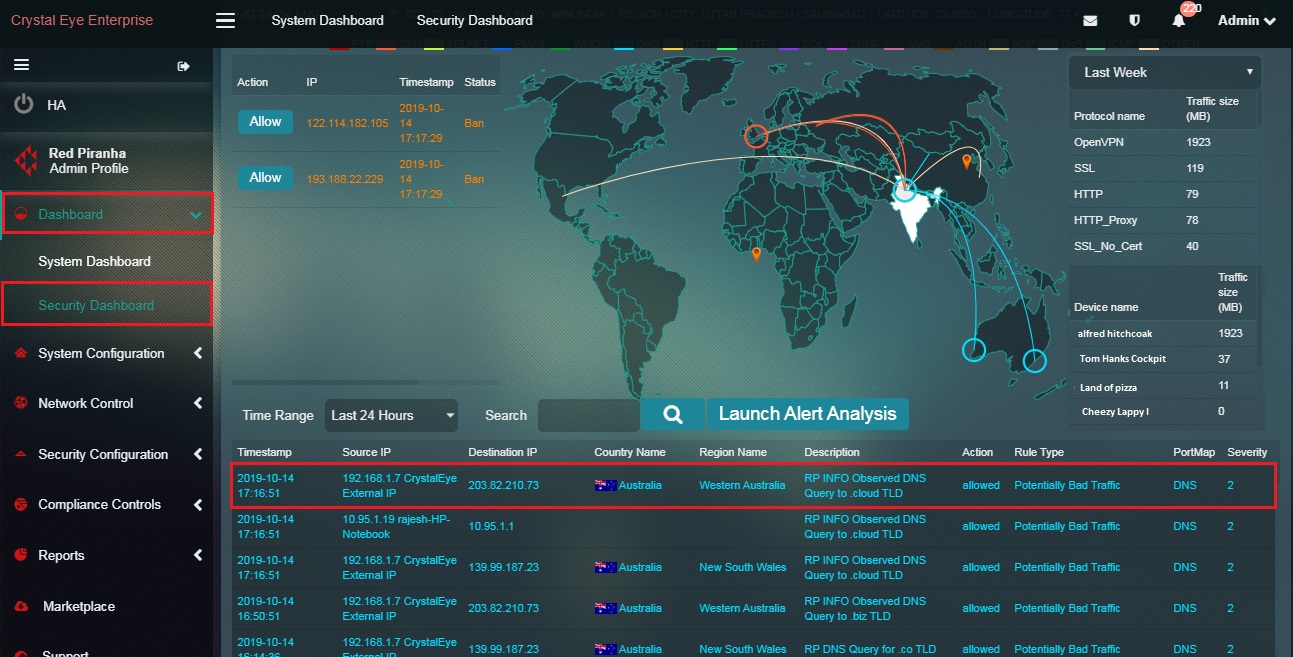
Step 2: You will now see a detailed report of the IDS/IPS alert details and the IDS/IPS rule details that triggered the alert.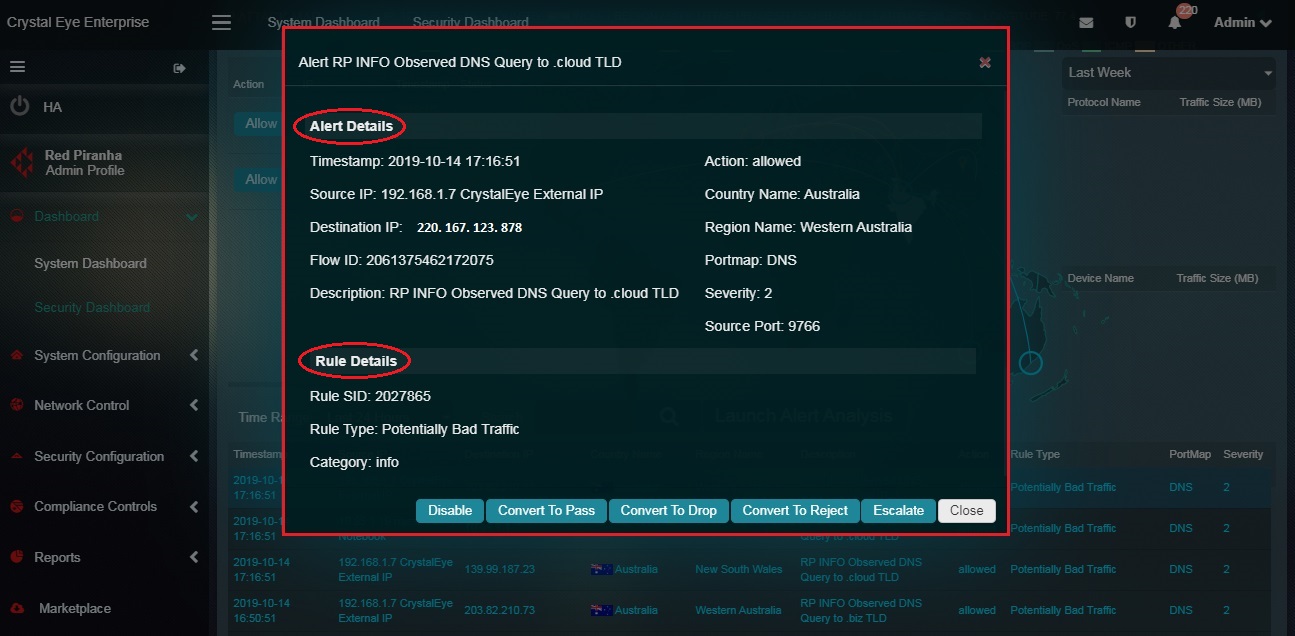
How to convert the IDS/IPS rules to Drop, Pass or Alert after it triggers an attack alert?
The IDS/IPS rule plays a vital role in stopping detected incidents that occur in the Crystal Eye network. However, the characteristics of these specially created rules can be changed.
These rules can be converted to Pass, Drop and Reject further defining the nature of the rules as discussed below.
Convert to Pass: After conversion of the rule action to Pass, if a signature matches, the packets are allowed by this rule and continue to be processed by subsequent rules in order
Convert to Drop: Post conversion of the rule to Drop, if a signature matches then the packet will be stopped and will not be allowed to move further into the network.
Convert to Reject: Post conversion of the rule to Reject, if a signature matches then the packet will not go through, and both the sender and receiver will receive a reject packet.
Step 1: In the Security Dashboard, click an IDS/IPS alert in the Alert Report. 
Step 2: You will now see a detailed report of the IDS/IPS alert details and the IDS/IPS rule details that triggered the alert. 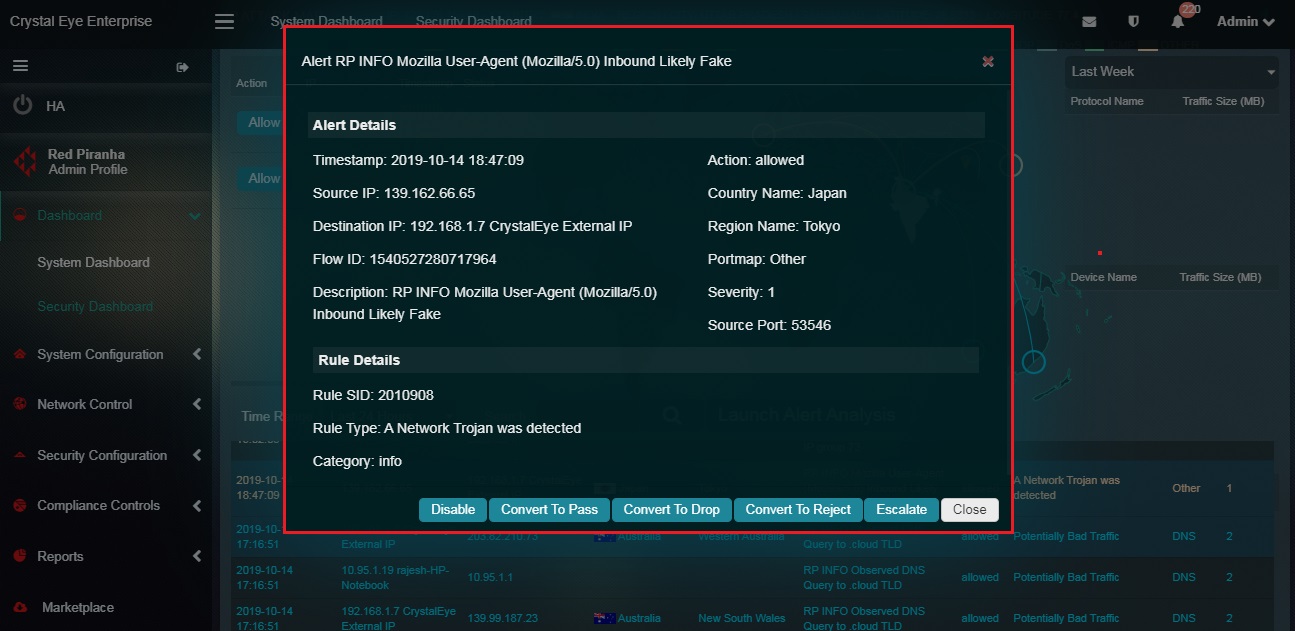
Step 3: Click Convert to Pass, Convert to Drop or Convert to Reject in the Alert Details pop-up. 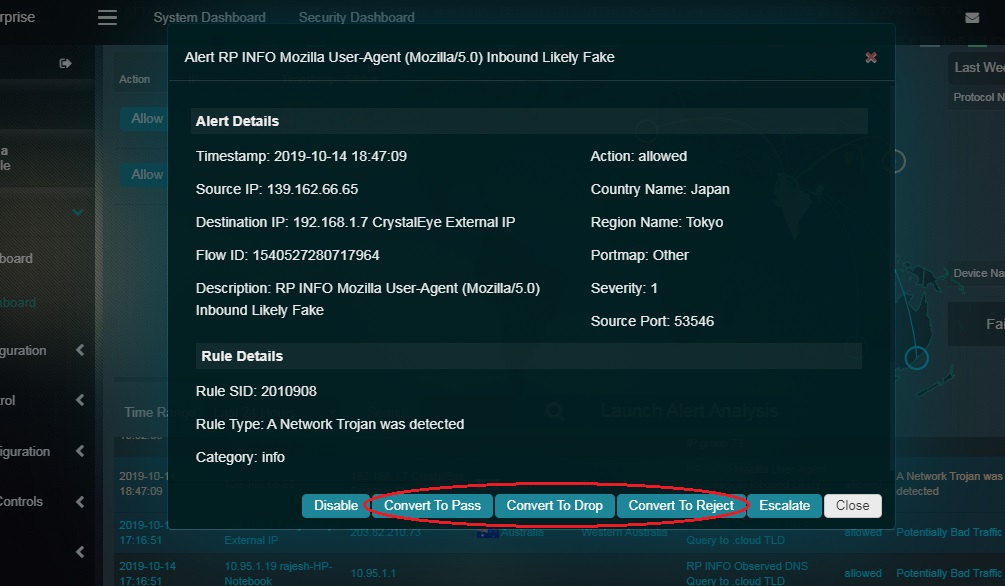
Note: If there is a requirement to dig in deeper to further analyse the IDS/IPS Alerts in detail then this can be done by hitting the Launch Alert Analysis button. You will then be directed to the IDS/IPS Alerts application where detailed PDF reports can be extracted for the purpose of analysis. 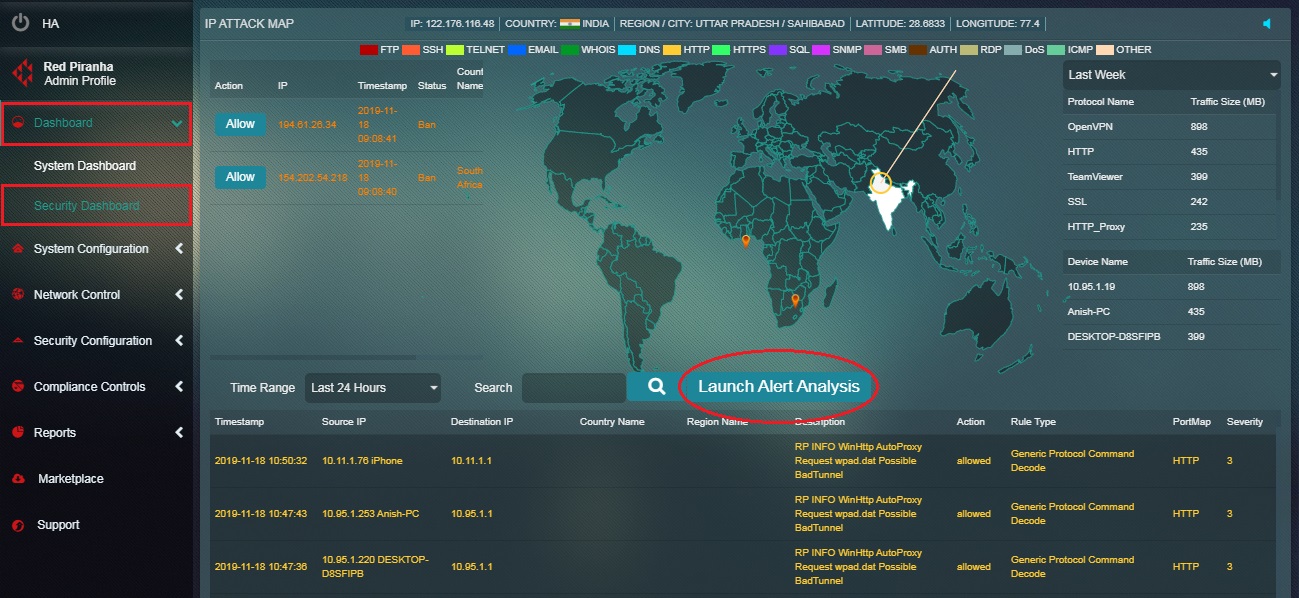
How to disable a particular IDS/IPS rule that triggered an IDS/IPS alert?
Crystal Eye administrator might come across situations when the IDS/IPS rule that triggered the alert must be disabled. In this case, the IDS/IPS alert must be clicked and then the disable IDS/IPS alert button must be clicked.
Step 1: In the Security Dashboard page, click the IDS/IPS alert for which the IDS/IPS rule needs to be disabled.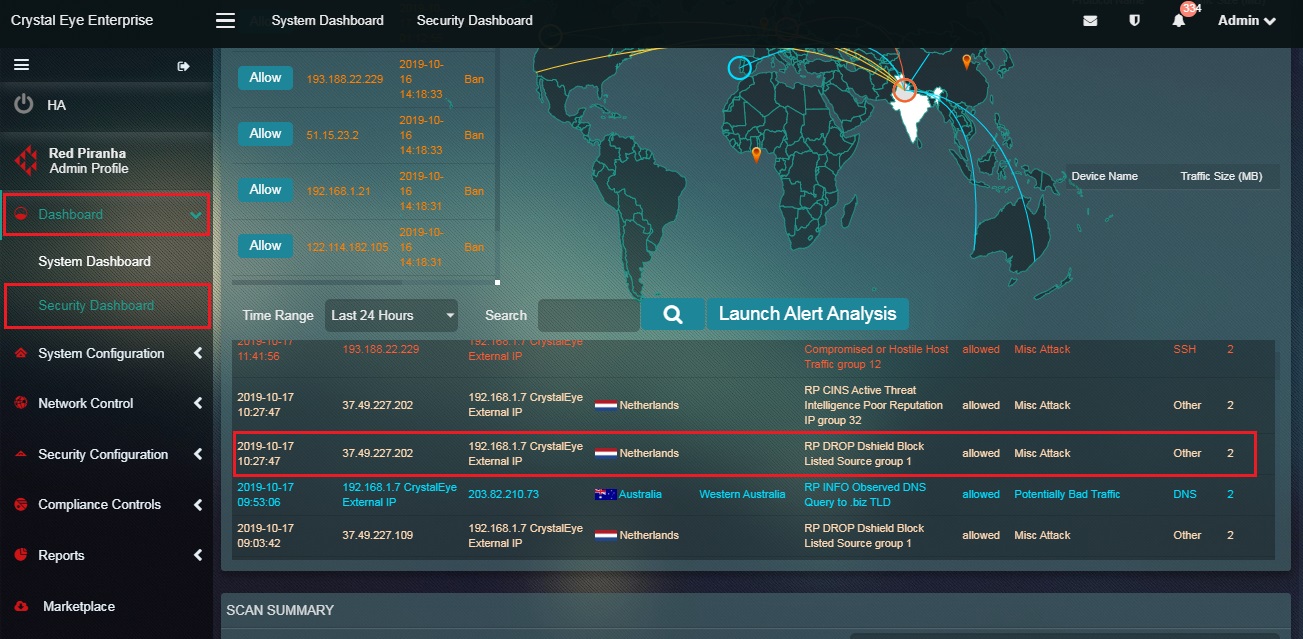
Step 2: You will now see the Alert Details and the Rule Details. Read the details and then click the Disable button.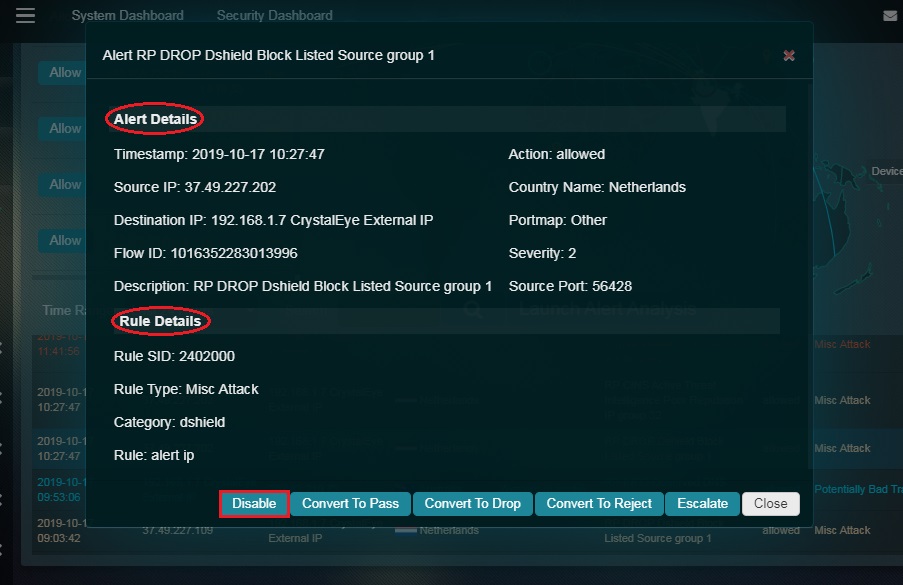
How to escalate an attack alert to Red Piranha’s security operations centre team for analysis from the Security Dashboard?
All attack alerts can be escalated to Red Piranha’s Security Operations Team after the Incident Response Services application is installed. Escalations will not be processed until the Incident Response Services application is installed and configured. The details of the alerts that are escalated are also mentioned in the Escalated Alerts section of the of the IDS/IPS Alerts application where a PDF report can also be generated for the same. Apart from Security Dashboard the IDS/IPS alerts can also be escalated to RP’s Secops team from the IDS/IPS Alerts Report section under the IP Attack Map application and the Inbox Report section and the Alerts section of the IDS/IPS Alert application.
Click here to know how to configure Incident Response Services application.
Note: If the Incident Response Services application is not installed and configured then the following error message will be displayed. 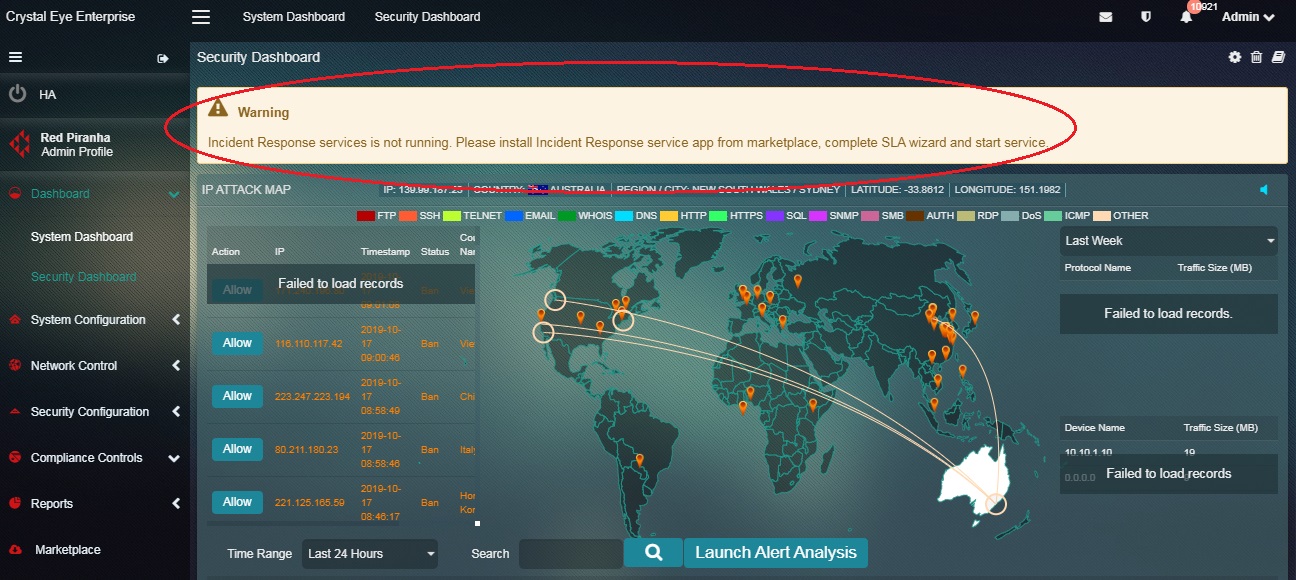
Step 1: In the Security Dashboard page, click the IDS/IPS alert that needs to be escalated.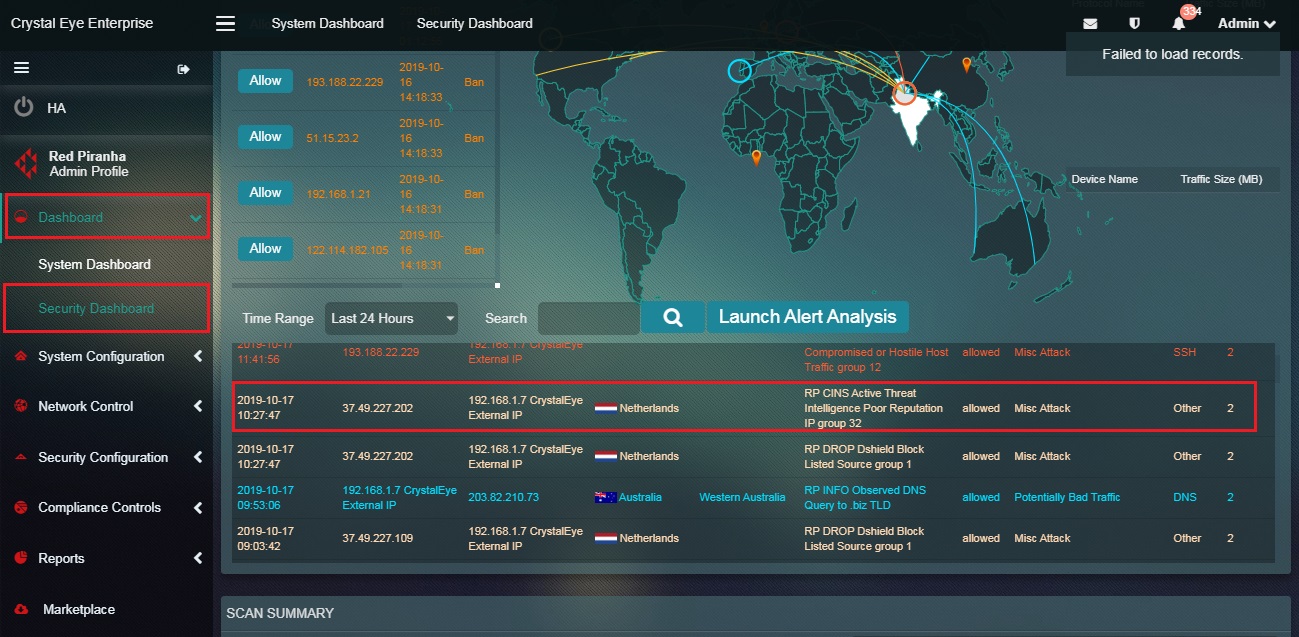
Note: Before you initiate the process of alert escalation to Red Piranha’s SOC team make sure that the Incident Response Services application is installed and configured. Click here to know how to configure the Incident Response Services application.
Step 2: You will now see the Alert Details and the Rule Details. Read the details and then click the Escalate button.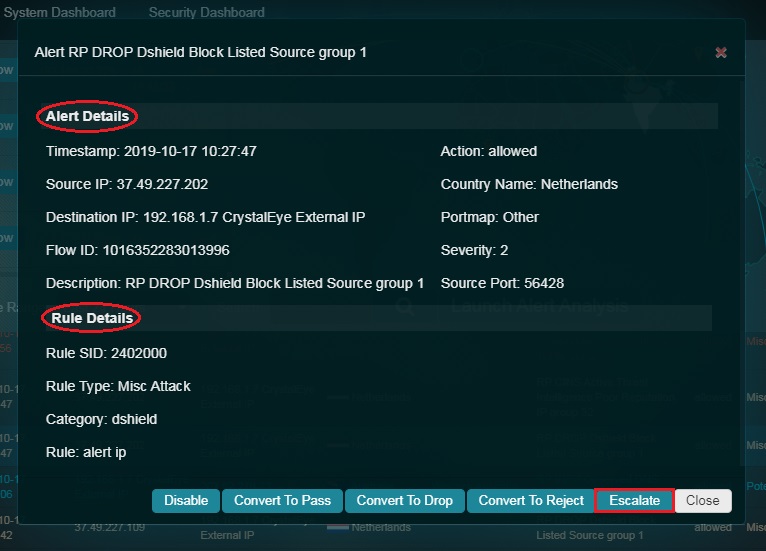
Step 3: You will now see a Comment Box. Add the comment and click the Submit button.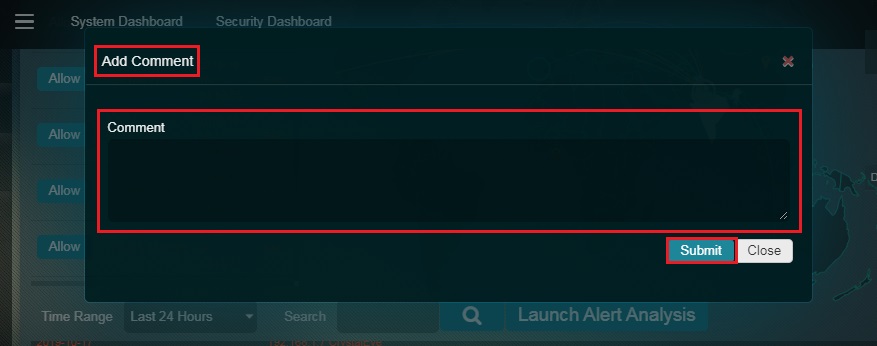
The Crystal Eye appliance has an inbuilt Gateway Antivirus that examines and evaluates files as they transit in real time. Crystal Eye makes use of a combination of signature and heuristic analysis to classify files to detect and automatically block malicious files in order to prevent infection from occurring. The Gateway Scan Summary section of the Security Dashboard displays the scan summary specifying details regarding the files that were blocked. These details include Timestamp, IP Address (where the malicious files were detected), Site (domain name from where the malicious files originated), Blocked URL (URL of the blocked file), Reason (why the file was blocked), Content Type and Description.
Note: The Gateway Scan Summary can also be viewed in the Scan Summary section of the Gateway Scan Report application and the AV Alerts Summary section under the IDS/IPS Alerts application. You can also download a PDF Scan Summary Report from the Gateway Scan Report application.
Crystal Eye administrators can also filter the scan report for a particular time bucket. All the flagged bad content in the Gateway Scan Summary are searchable through the search bar. The files that are blocked can also be allowed to get past Crystal Eye’s AV and can also be escalated to Red Piranha’s Security Operations Team (RP Secops) for further analysis. The escalation process can only be done if the Incident Response Services application is installed and configured.
How to Filter Scan Report as per Time Range?
Step 1: In the Security Dashboard, select the Time Range from the dropdown.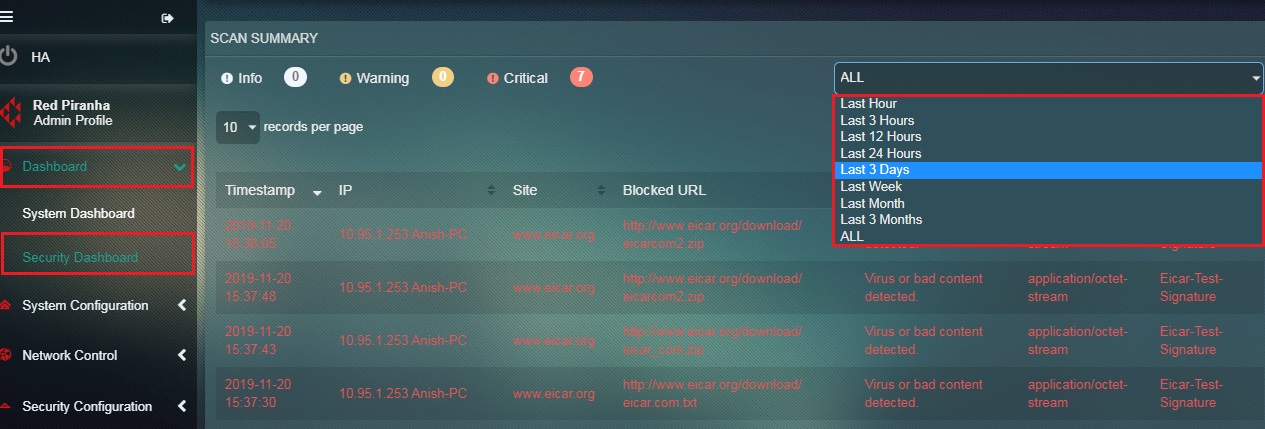
Step 2: You will now see the Scan summary for the selected time range.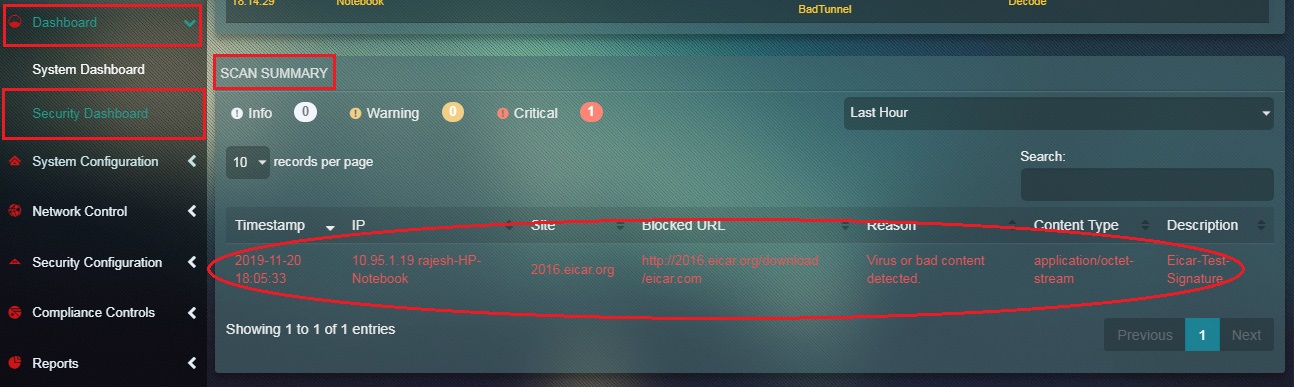
Note: Here we have selected the time range as ‘past 1 hour’ so that the scan summary shows all the files that were blocked in the past 1 hour.
How to Allow a Flagged Bad Content from the Gateway Scan Summary in the Security Dashboard?
Step 1: In the Security Dashboard, click the flagged bad content in the Gateway Scan Summary section.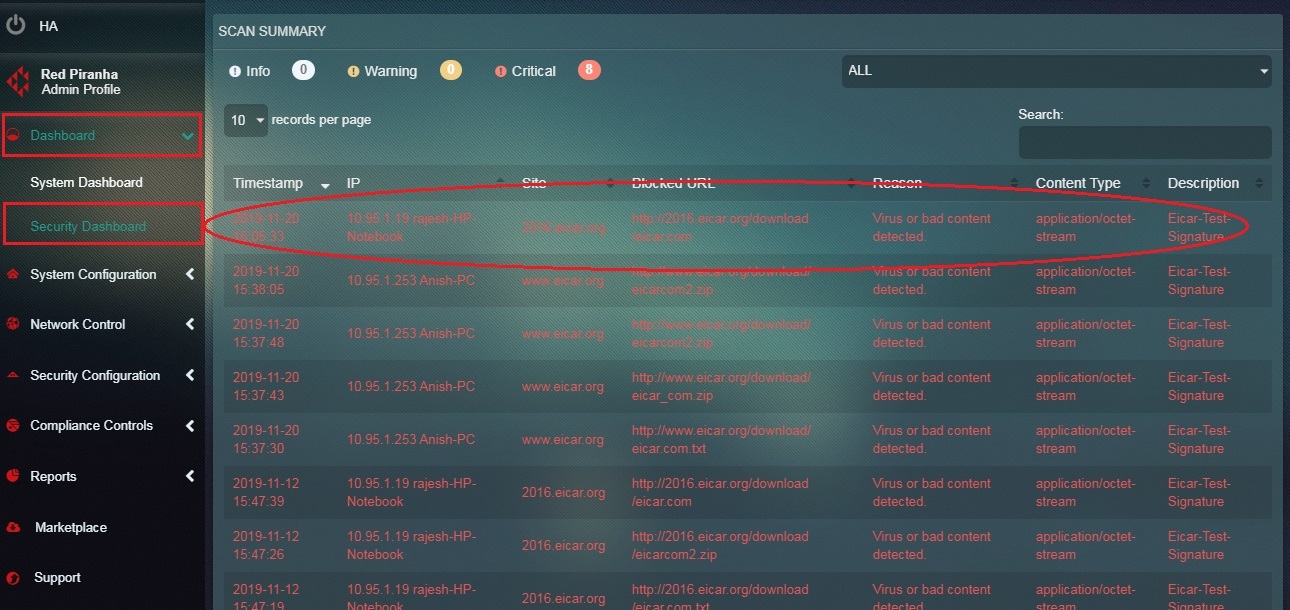
Step 2: You will now see the Scan Information pop-up. Click the Allow button. 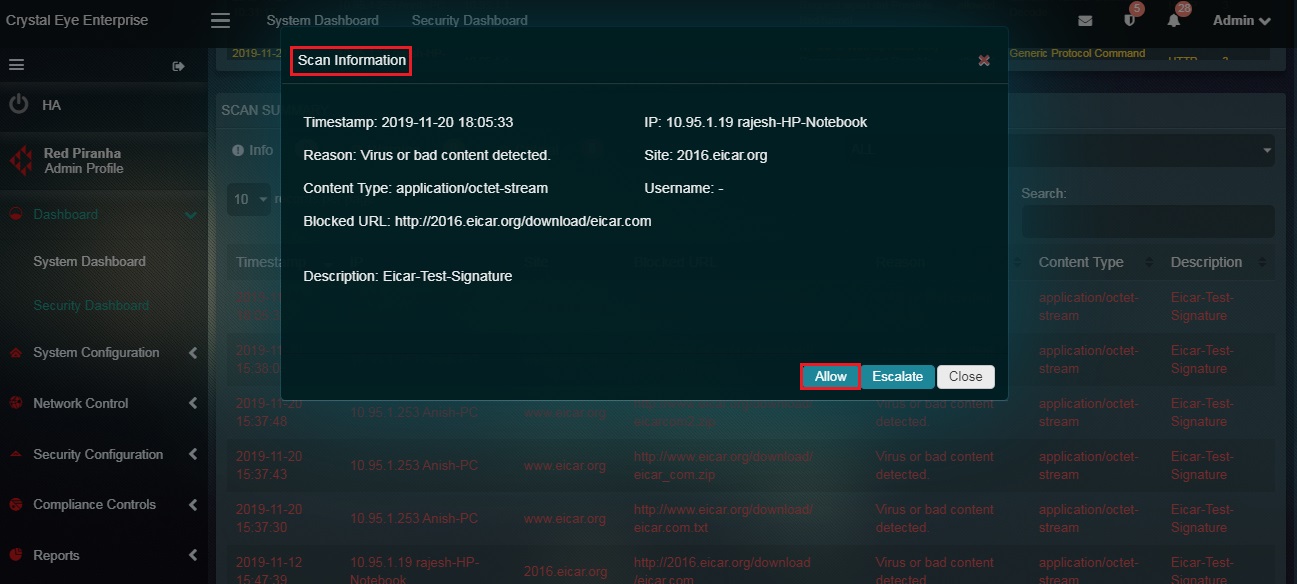
Step 3: You will now see the message, “Successfully Allowed Site’’. As mentioned in the screenshot below.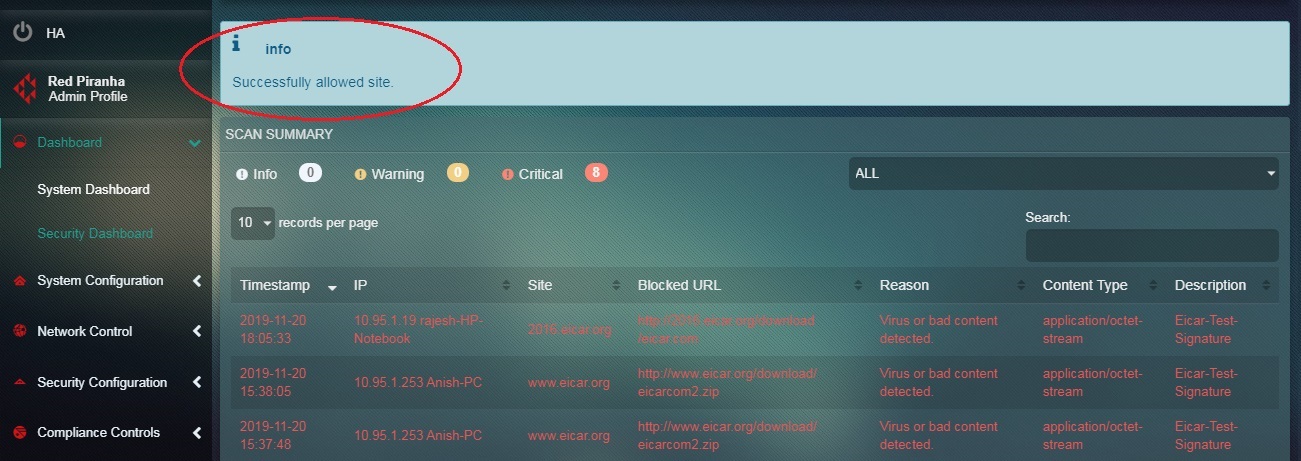
Note: Once the flagged bad content is allowed the website from where the file was downloaded gets included in the Exception Sites section of the Content Filter application. However, the inclusion of the website would remain limited to the exception sites section of the content filter policy assigned to the IP address where the bad content was detected at the first place.
How to Escalate the ‘Flagged Bad Content’ Displayed in the Gateway Scan Summary to RP’s Secops Team?
Before escalating the ‘flagged bad content’ to RP’s Secops Team it must be ensured that the Incident Response Services application is installed from the marketplace and configured as well. Apart from the Security Dashboard a ‘flagged bad content’ can also be escalated from the Scan Summary section of the Gateway Scan Report application and the AV Alerts Summary section under the IDS/IPS Alerts application.
Step 1: In the Security Dashboard, click the flagged bad content displayed in the Gateway Scan Summary.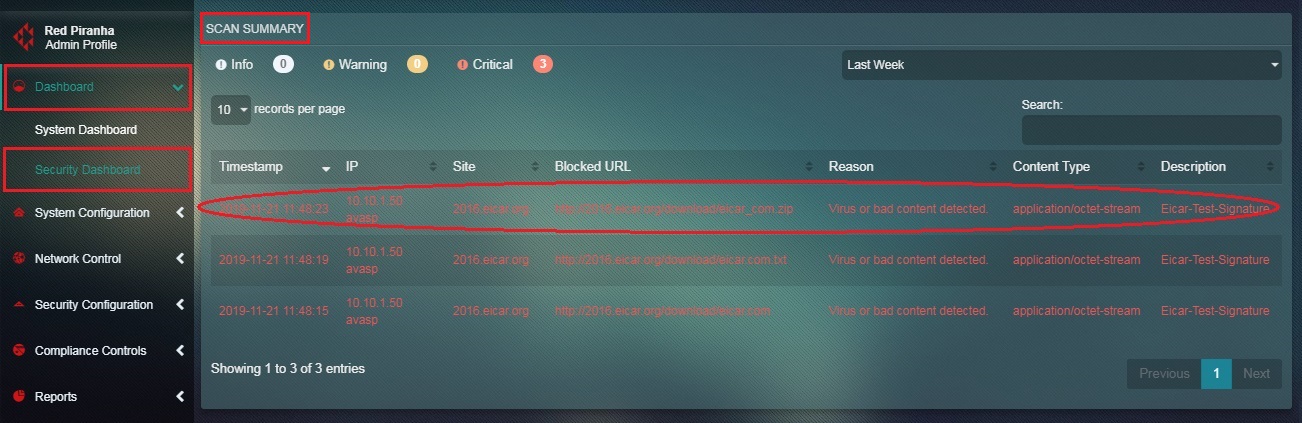
Step 2: You will now see the Scan Information pop-up. Click the Escalate button.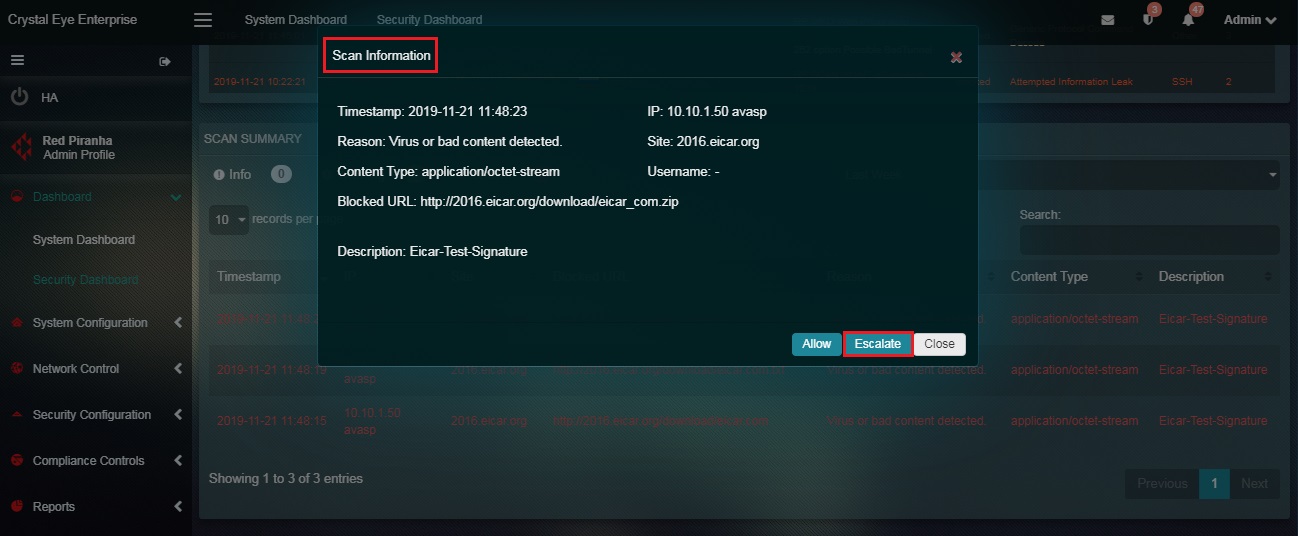
Note: You will now see the message, “Alert Escalated Successfully”. Refer to the screenshot below.
The IDS/IPS Statistics widget is a graphical representation showing the total number of IDS/IPS related alerts, netflow events, DNS requests, SSH connections and top alerts rule SID triggered on a particular day at a particular time. The data can be adjusted and can be displayed according to the desired time period which can be selected from the dropdown.
The 6 types of graphs that can be displayed in this widget are related to Alert, Flow, DNS, SSH and Top Alerts Rule SID. These graphs can also be viewed in the Reports section of the IDS/IPS Alerts application.
How to view different graph types related to Alert, Flow, DNS, SSH and Top Alerts Rule SID?
There are two dropdowns in the top panel of the IDS/IPS alerts statistics widget which can be used to control the data displayed here. Using the first dropdown (refer to the screenshot below) the CE administrator can select the required data type to display corresponding information in the graph related to Alert, Flow, DNS, SSH and Top Alerts Rule SID. 
The second dropdown can be used to select a time range to further filter the report. This helps in segregating data and analysing alert information belonging to a particular time range.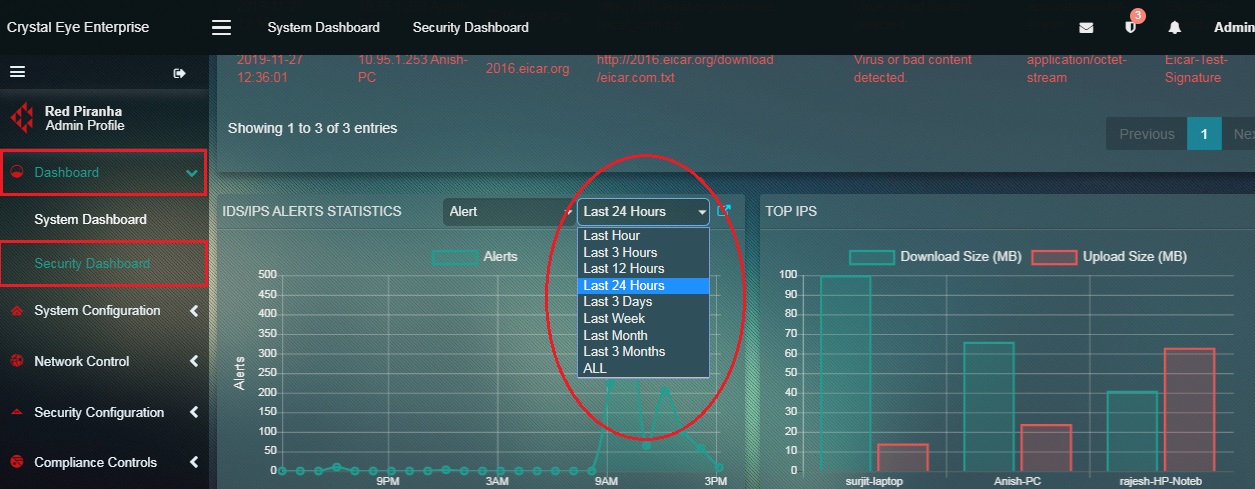
How to Interpret the Graphical Data Related to Alert in the IDS/IPS Alerts Statistics Widget?
Step 1: In the IDS/IPS Alerts Statistics widget, select Alert from the first dropdown in the top panel.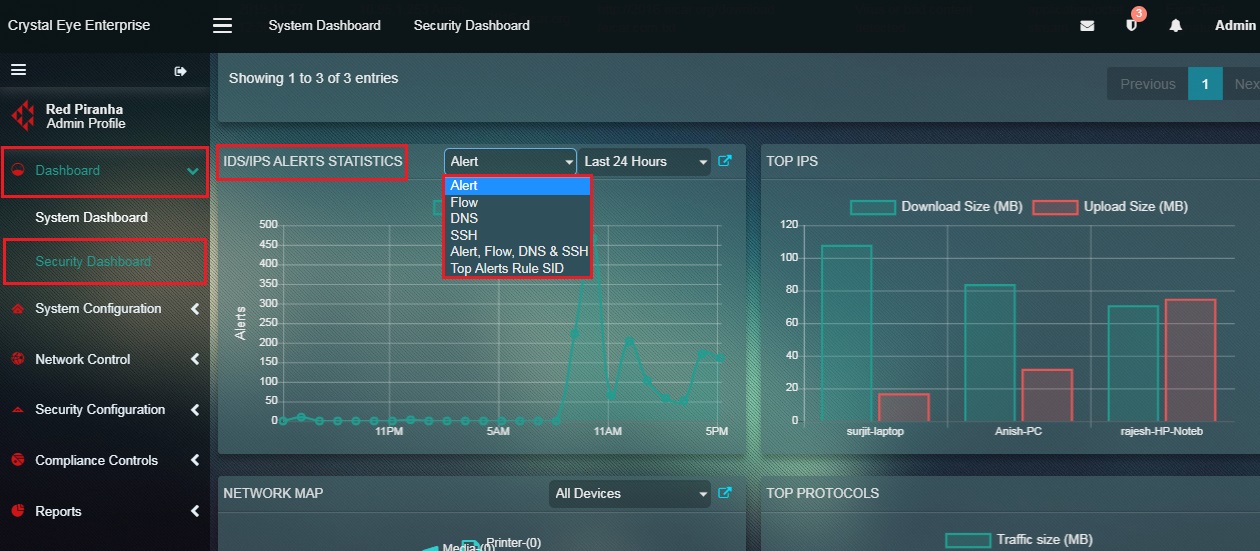
Step 2: You will now see the Alerts graph. The y-axis shows the number of alerts and the x-axis shows the time.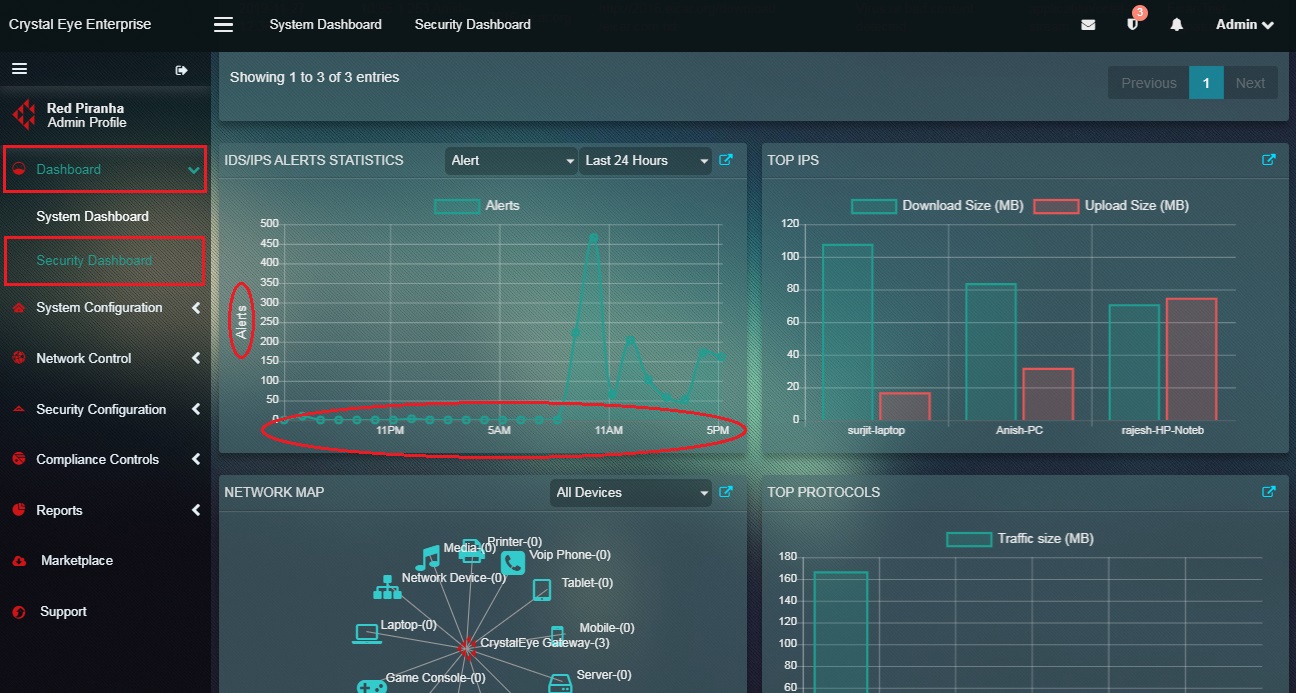
Note: Point the cursor to the graph points (as mentioned in the screenshot below) and you will see a pop-up showing the number of alerts recorded at that particular date and time.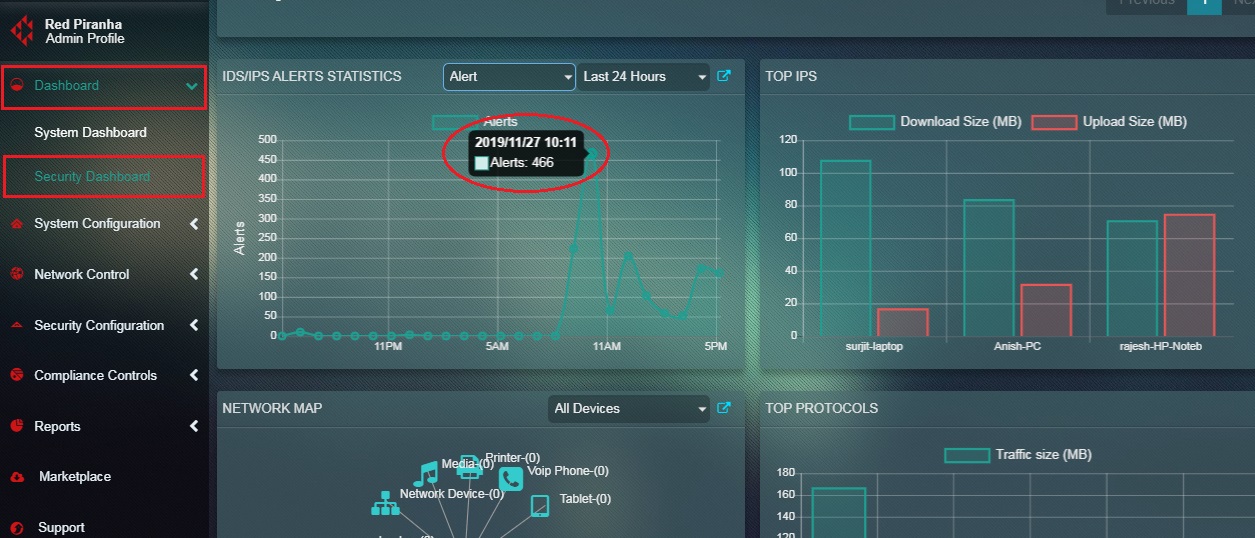
How to Interpret Graphical Data Related to Flow Count in the IDS/IPS Alerts Statistics Widget?
Step 1: In the IDS/IPS Alerts Statistics widget, select Flow from the first dropdown in the top panel.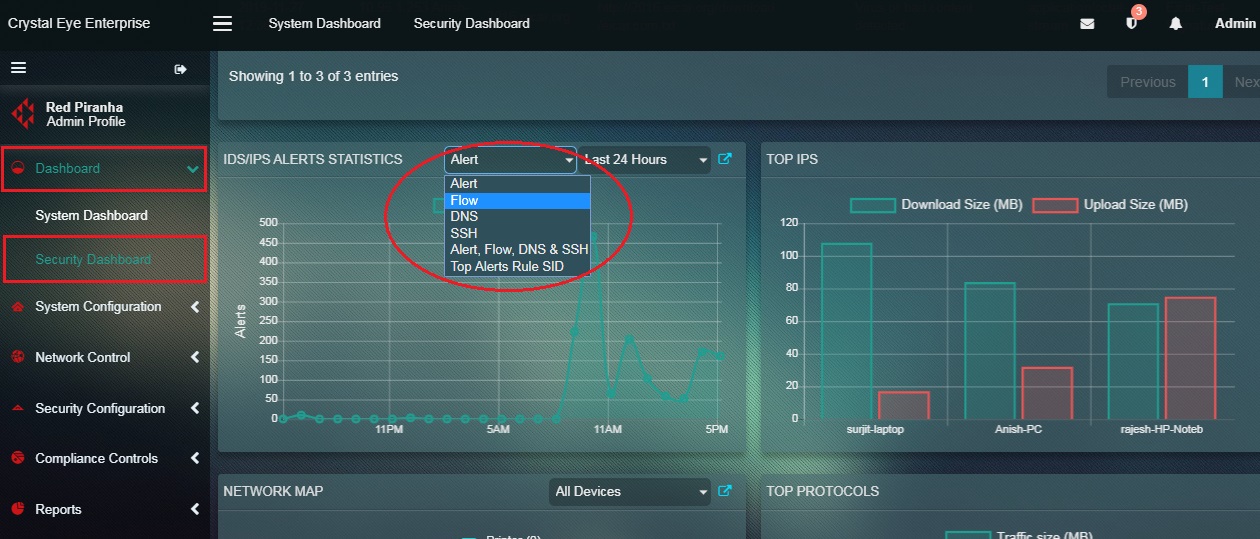
Step 2: You will now see the Flow graph. The y-axis shows the number of flow counts and the x-axis shows the time.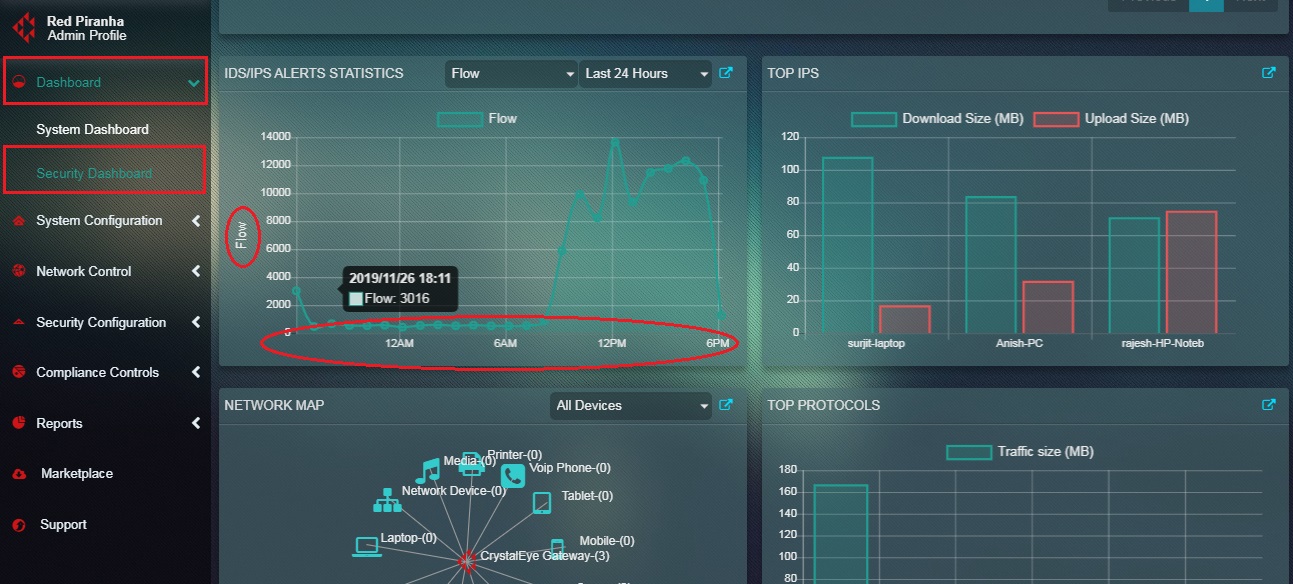
Note: Point the cursor to the graph points (as mentioned in the screenshot below) and you will see a pop-up showing the number of Netflow counts recorded by the Crystal Eye appliance at a particular date and time.
How to interpret graphical data related to the number of DNS requests recorded by the Crystal Eye appliance?
Step 1: In the IDS/IPS Alerts Statistics widget, select DNS from the first dropdown in the top panel.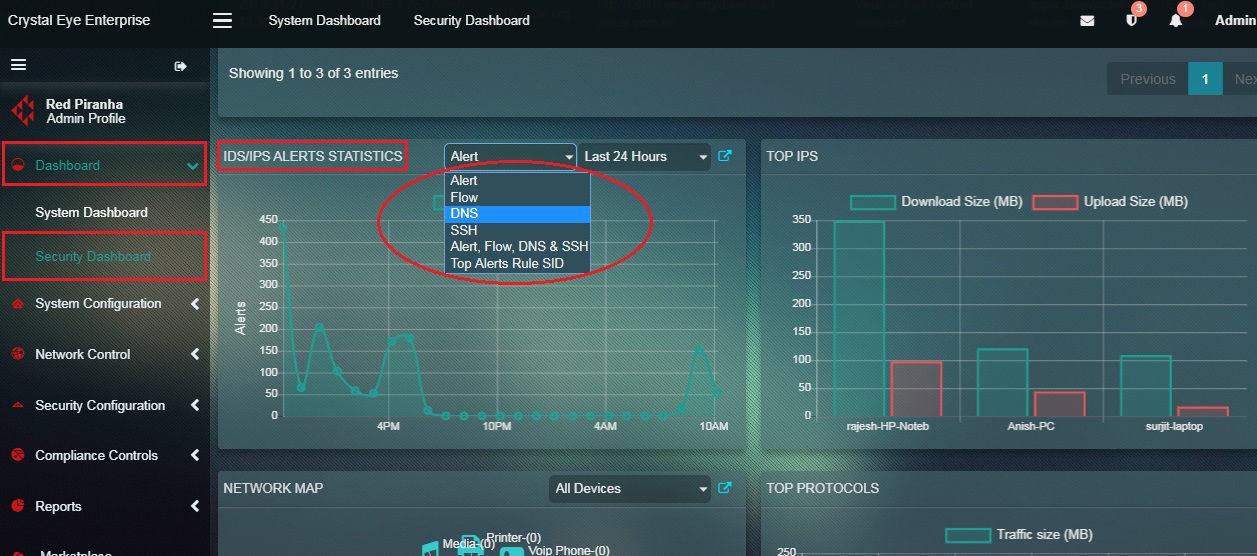
Step 2: You will now see the DNS requests graph. The y-axis shows the number of DNS requests and the x-axis shows the time.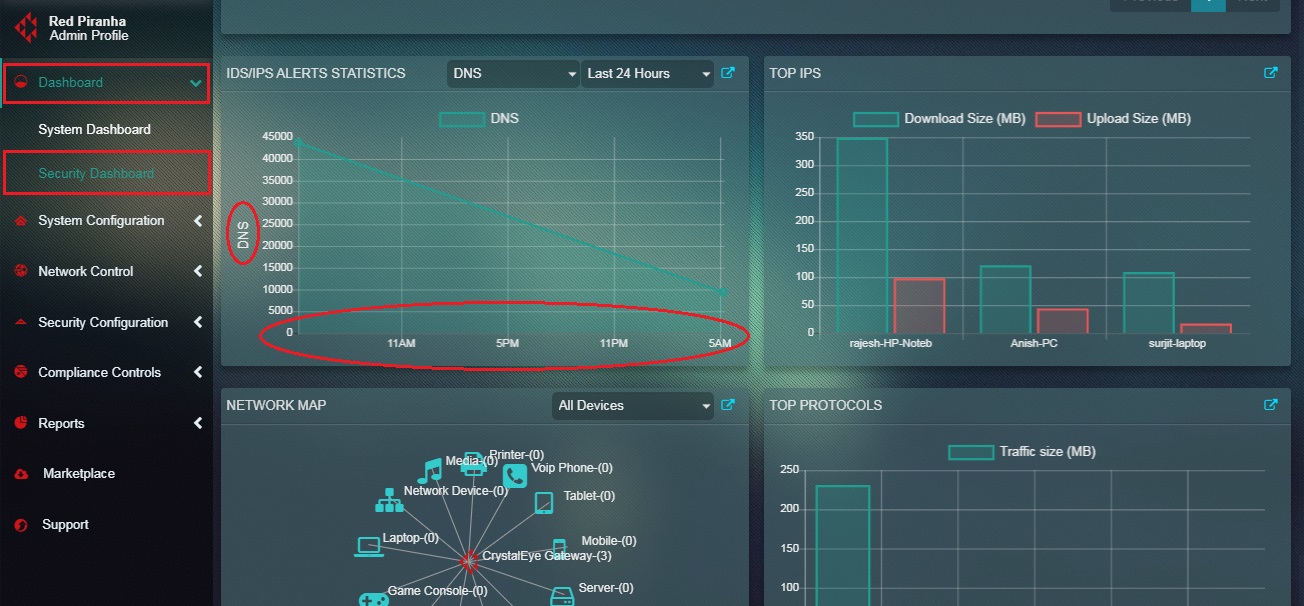
Note: Point the cursor to the graph points (as mentioned in the screenshot below) and you will see a pop-up showing the number of DNS requests recorded by the Crystal Eye appliance at that particular date and time.
How to interpret graphical data related to SSH connections recorded by the Crystal Eye appliance?
Step 1: In the IDS/IPS Alerts Statistics widget, select SSH from the first dropdown in the top panel. 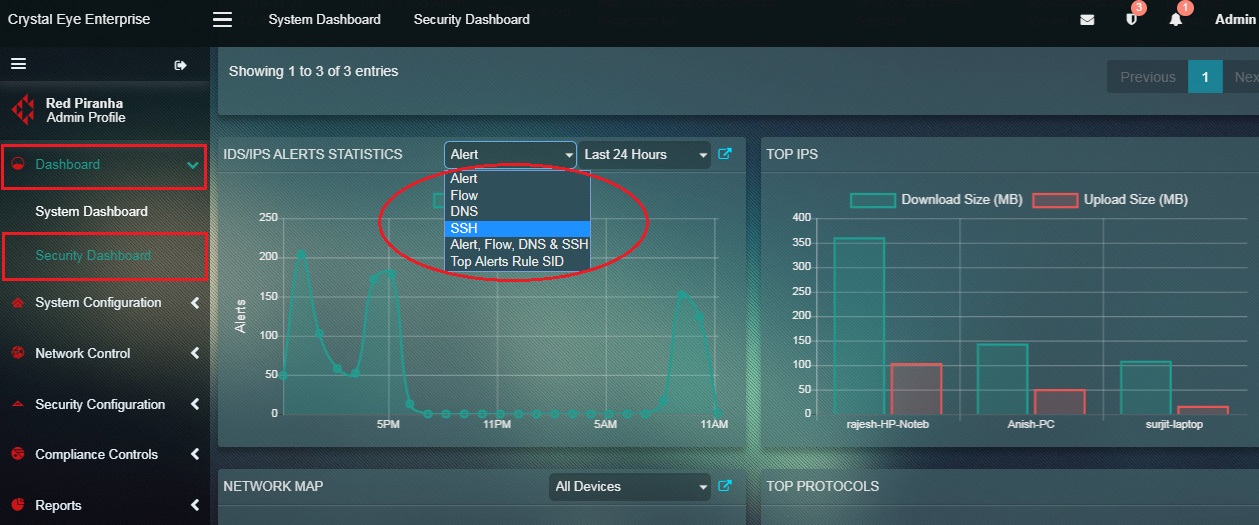
Step 2: You will now see the SSH graph. The y-axis shows the number of SSH connections and the x-axis shows the time. 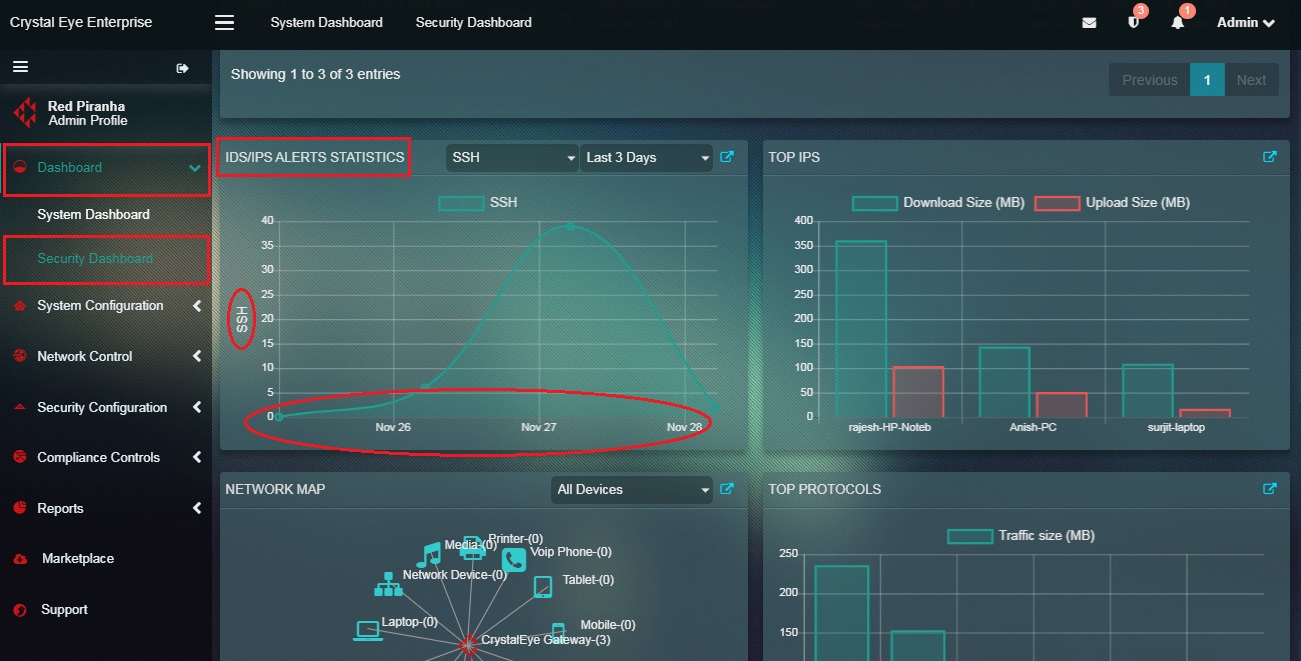
Note: Point the cursor to the graph points (as mentioned in the screenshot below) and you will see a pop-up showing the number of SSH connections recorded by the Crystal Eye appliance at a particular date and time. 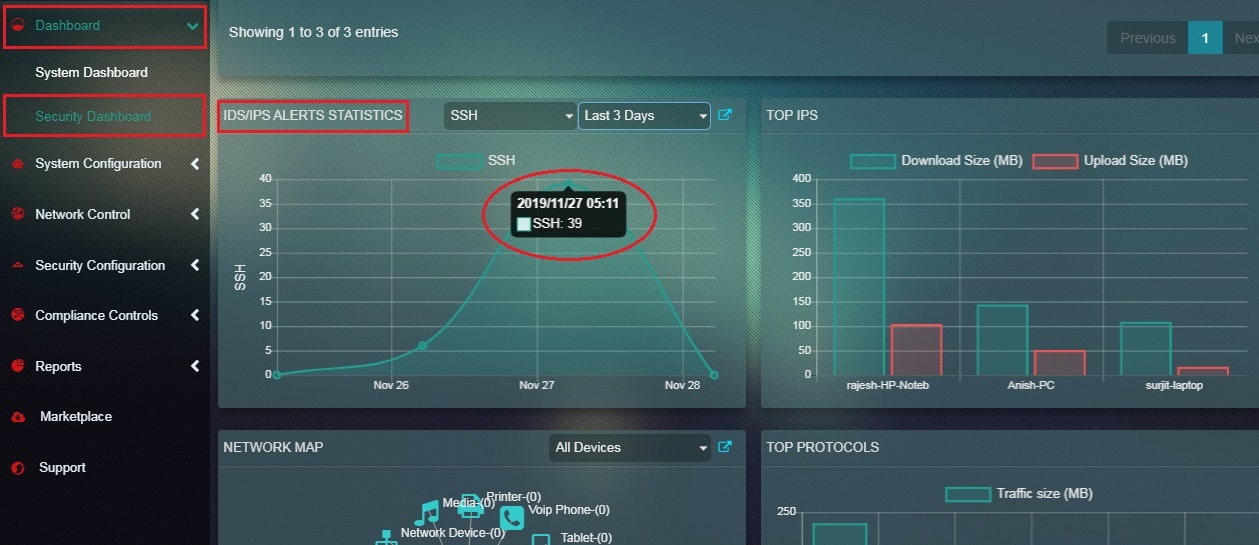
How to view Alert, Netflow Count, DNS Requests, and SSH Connections on a single graph?
Step 1: In the IDS/IPS Alerts Statistics widget, select Alert, Flow, DNS & SSH from the first dropdown in the top panel. 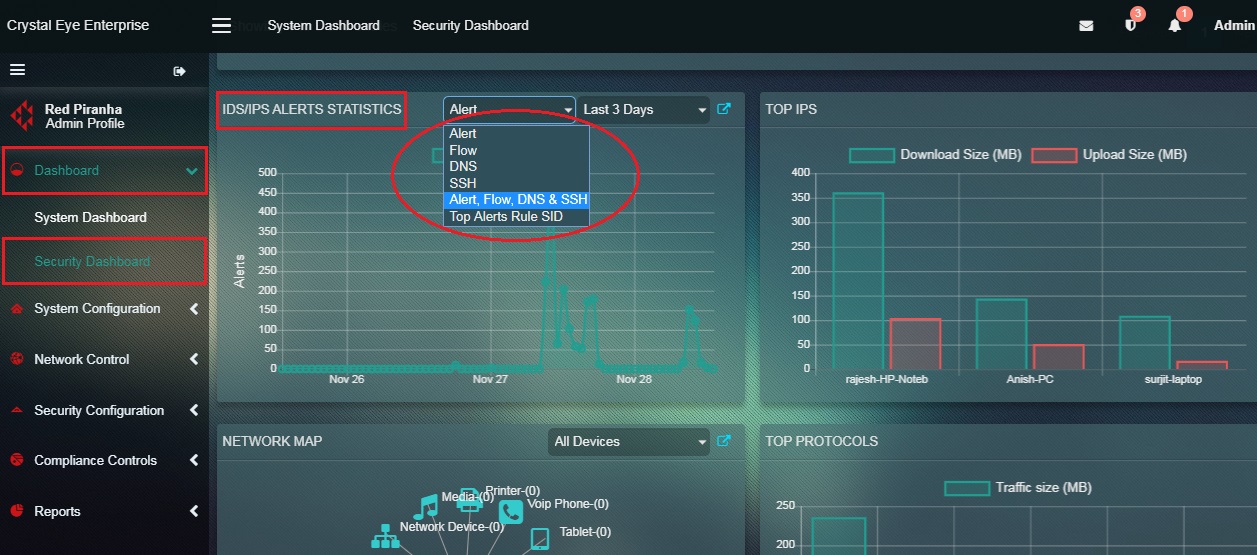
Step 2: You will now see the combined graph of Alert, Flow, DNS and SSH. The y-axis shows the Alerts, Netflow count, DNS requests and SSH a connection recorded by the CE appliance and the x-axis shows the time.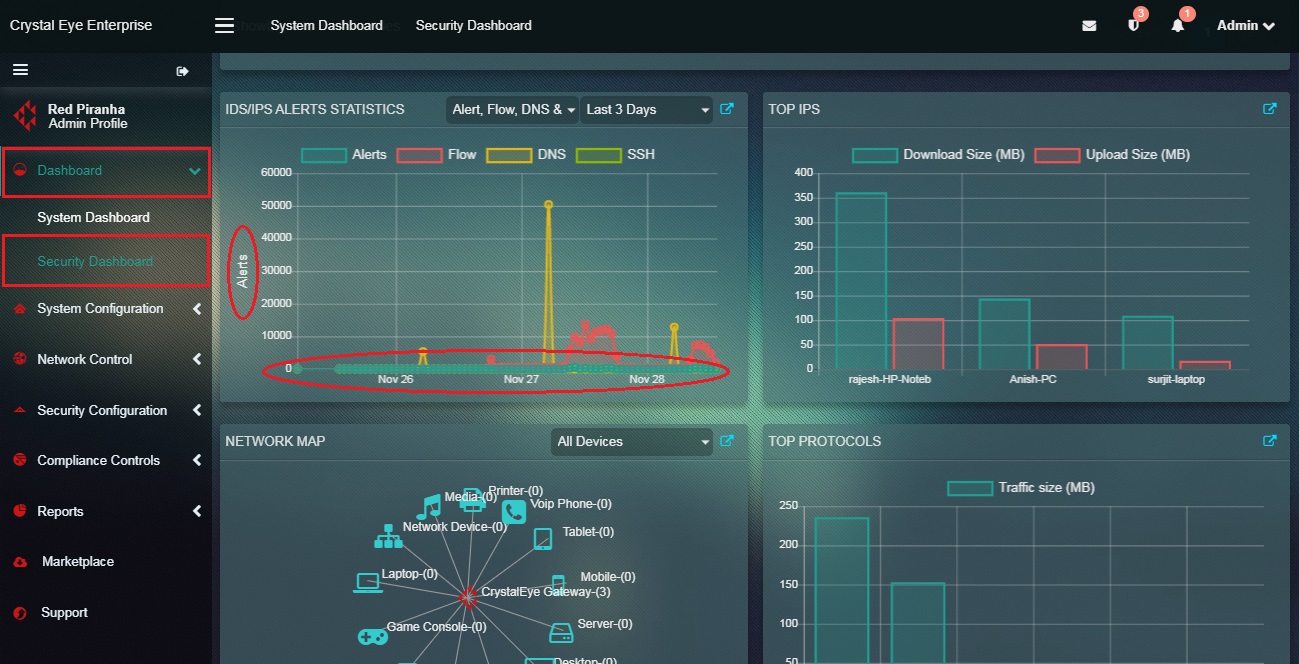
Note: Point the cursor to the graph points (as mentioned in the screenshot below) and you will see a pop-up showing the number of Alerts, Flow counts, DNS requests, and SSH connections recorded by the Crystal Eye appliance at a particular date and time.
How to view the Top Alerts Rule SID graph in the IDS/IPS Alerts Statistics widget?
Step 1: In the IDS/IPS Alerts Statistics page, select Top Alerts Rule SID from the first dropdown.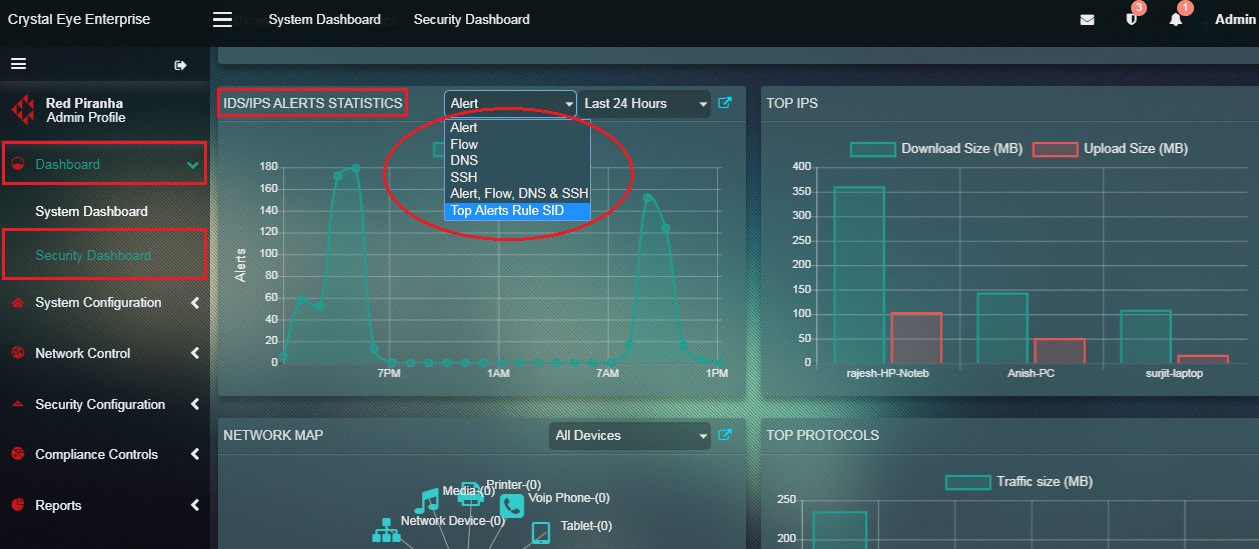
Step 2: You will now see the Top Alerts Rule SID graph. The y-axis shows the number of times an SID rule was triggered and the x-axis shows the Signature Identification Number (SID). 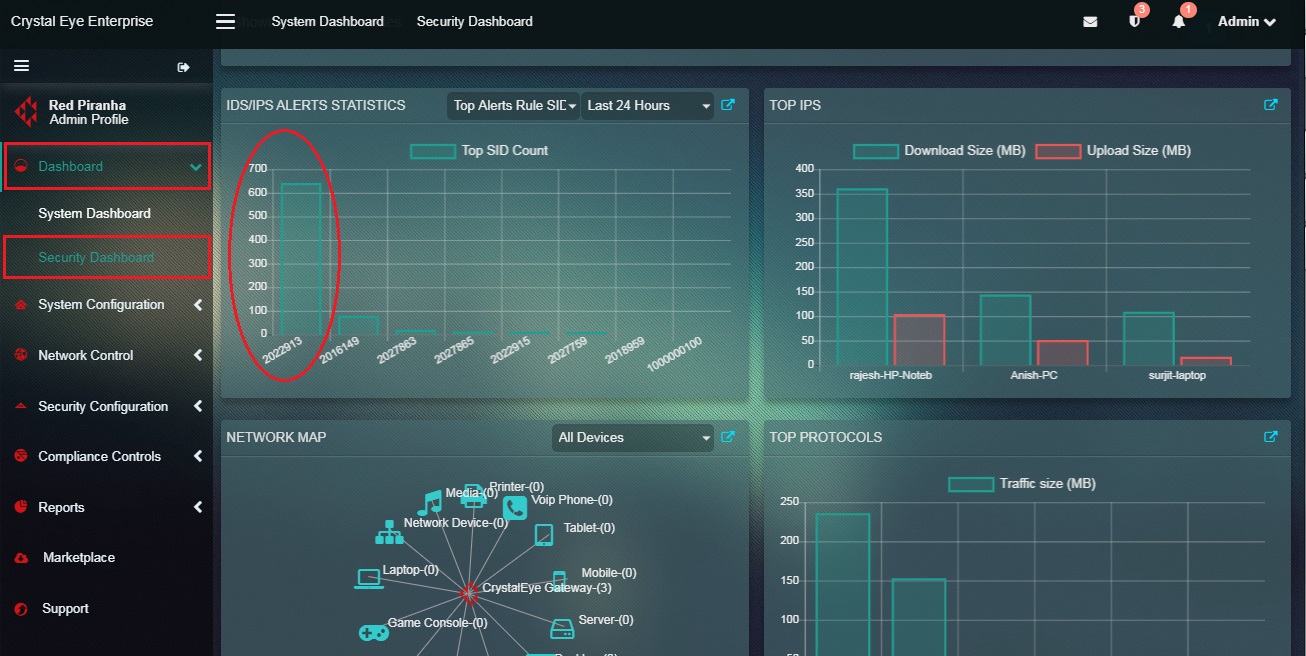
Note: In the screenshot above, SID number 2022913 on the x-axis of the graph shows that it was triggered over 600 times in the past 24 hours.
How to fetch in-depth information about the IDS/IPS Alerts from Crystal Eye’s Security Dashboard?
Step 1: In the Security Dashboard, click the link icon in the top-right corner of the IDS/IPS Alerts widget.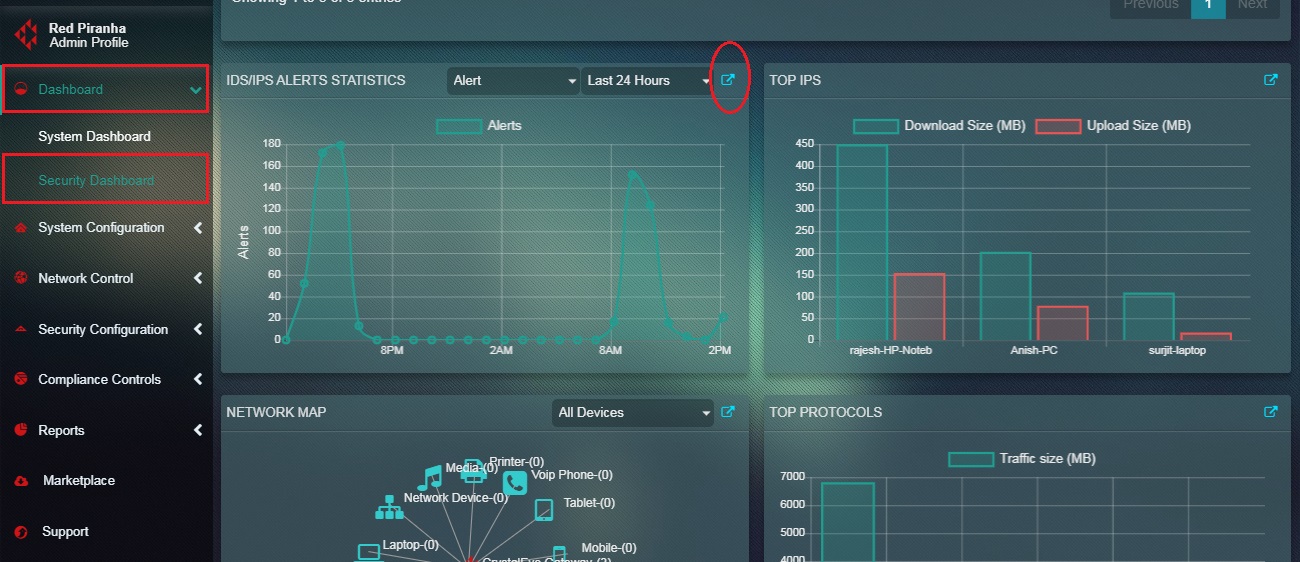
Note: You will now be directed to the IDS/IPS Alerts application. Here you will gain access to in-depth information about Alerts, Escalated Alerts, Events, AV Alerts, Escalated AV Alerts, Alerts Report, Netflow Report, DNS Report, and SSH Report. The CE administrator also has the leverage to export and send a Summary report to any email address. The report can also be scheduled to be delivered to an email address on a daily, weekly and monthly basis or can be sent instantly as well. All these reports can be filtered according to a particular time range.
The Top IPs widget displays a graph that depicts the download size and uploads size of data transferred to and from devices connected to the Crystal Eye network.
Note: The information related to the download size and uploads size of data transferred to and from devices connected to the Crystal Eye network is also available in the Device Traffic Size Indicator section of the IP Attack Map (both in the Security Dashboard and the IP Attack Map application). You can also view this information in the Top IPs section of the Network Detail Report application.
How to interpret the data mentioned in the Top IPs widget of the Security Dashboard?
The Top IPs widget in the security dashboard shows top devices connected to the CE network in terms of the amount of data transferred and received by them.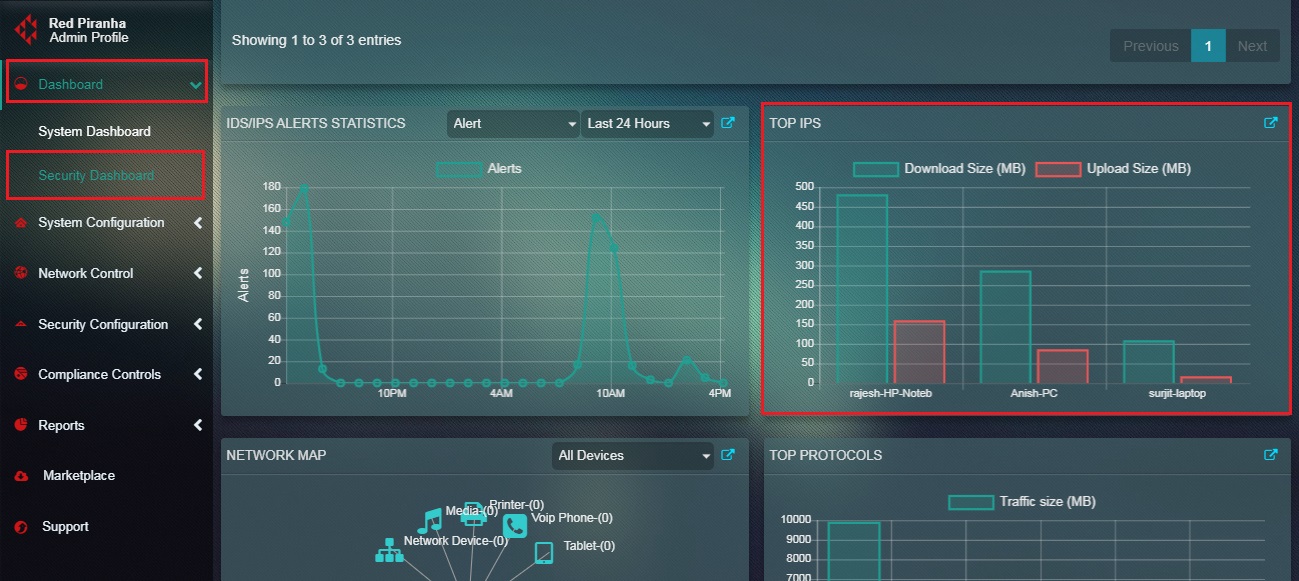
In the above graph, the information related to the data transferred and received have been segregated and displayed in a bar graph format (the green bar shows the download size and the red bar shows the upload size).
How to view in-depth network report covering various aspects related to monitoring data transfer size and number of data packets transferred in the Crystal Eye network?
Step 1: In the Top IPs widget of the Security Dashboard, click the link icon on the top-right side of the widget.![]()
Note: You will now be directed to the Network Detail Report application. Here you will be able to view reports related to the packets downloaded and uploaded, and size of the data downloaded and uploaded on a particular device in the CE network. You can also view the data size transferred to and received from external IP addresses.
The Network Map widget shows a diagrammatic view of the device types and the devices connected to the Crystal Eye Network. Visual depiction of the Crystal Eye network is done through a hub and spoke diagram where the hub is the Crystal Eye appliance (network gateway) and the spokes are the device types connected to the Crystal Eye network. 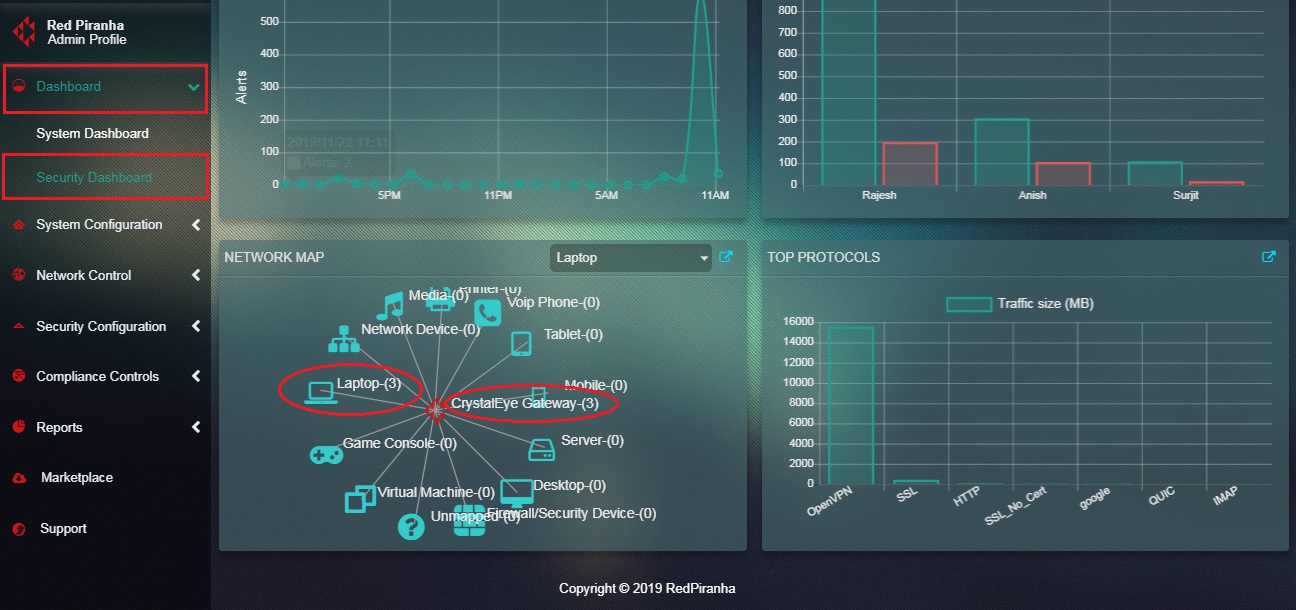
In the above screenshot of the Network Map widget, you would observe that there are 3 Laptops connected to the Crystal Eye network. The total number of devices connected to the Crystal Eye network is shown in Crystal Eye gateway.
The Network Map widget has multiple functionalities built into it that facilitates device mapping and assigning content filter policy to the device. Mapping devices to the Crystal Eye network includes assigning username, nickname, vendor, IP address, and the device type.
Note: As a matter of convenience, you can map devices and assign content filter policies from the Network Map application alternatively. In order to go to Network Map application from the Security Dashboard, click the link icon in the top panel of the Network Map widget (Refer to the screenshot below). 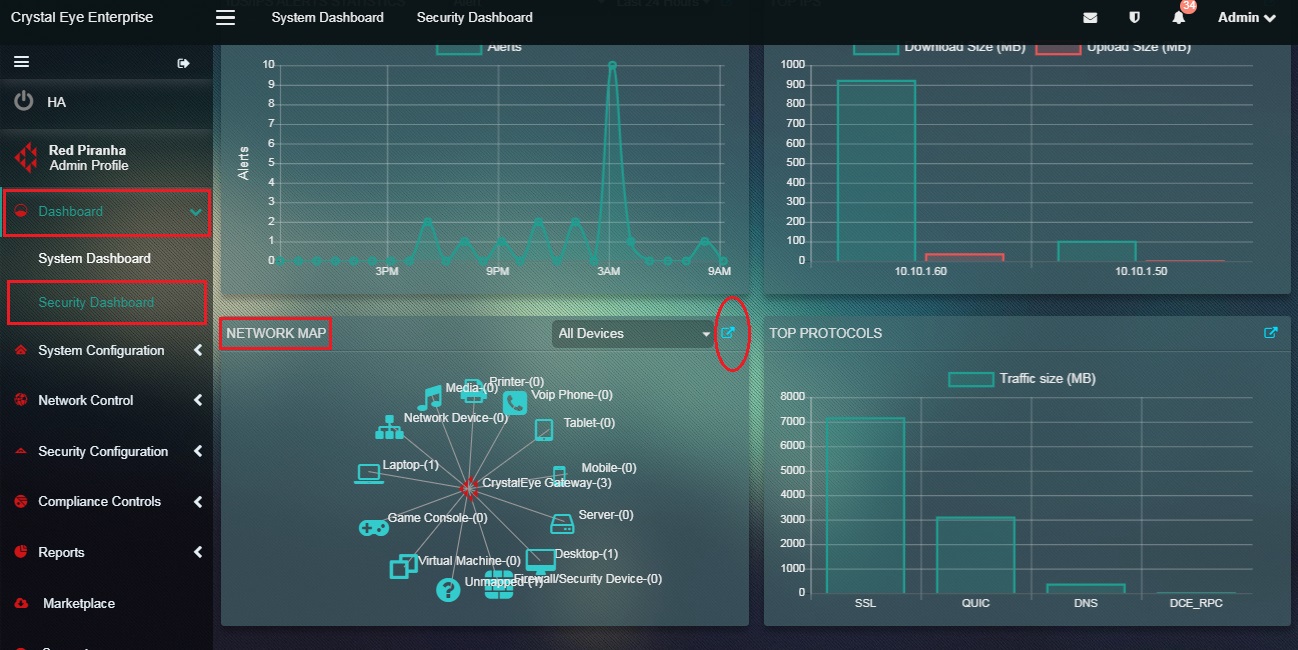
How to segregate the Crystal Eye network to identify various devices and view its IP address in the Network Map widget?
Step 1: In the Security Dashboard, click the device type category on the hub and spoke diagram under the Network Map widget. In the screenshot below, we will click the device type Laptop.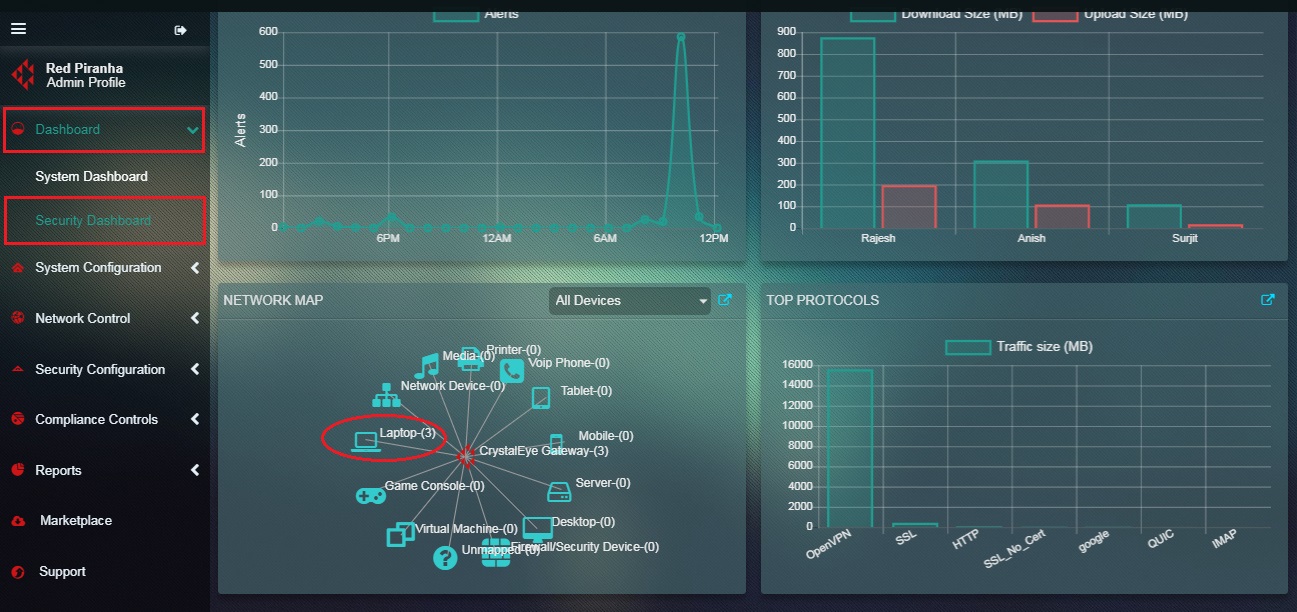
Note: Alternatively you may select the device type Laptop from the dropdown.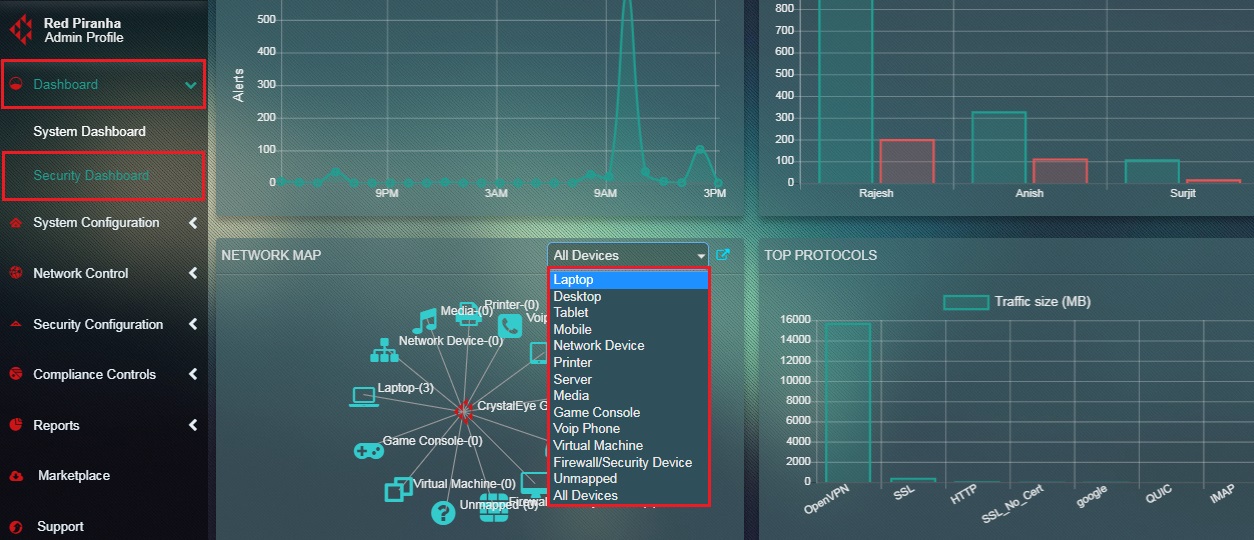
Step 2: You will now see the IP address of all the Laptops connected to the Crystal Eye network. 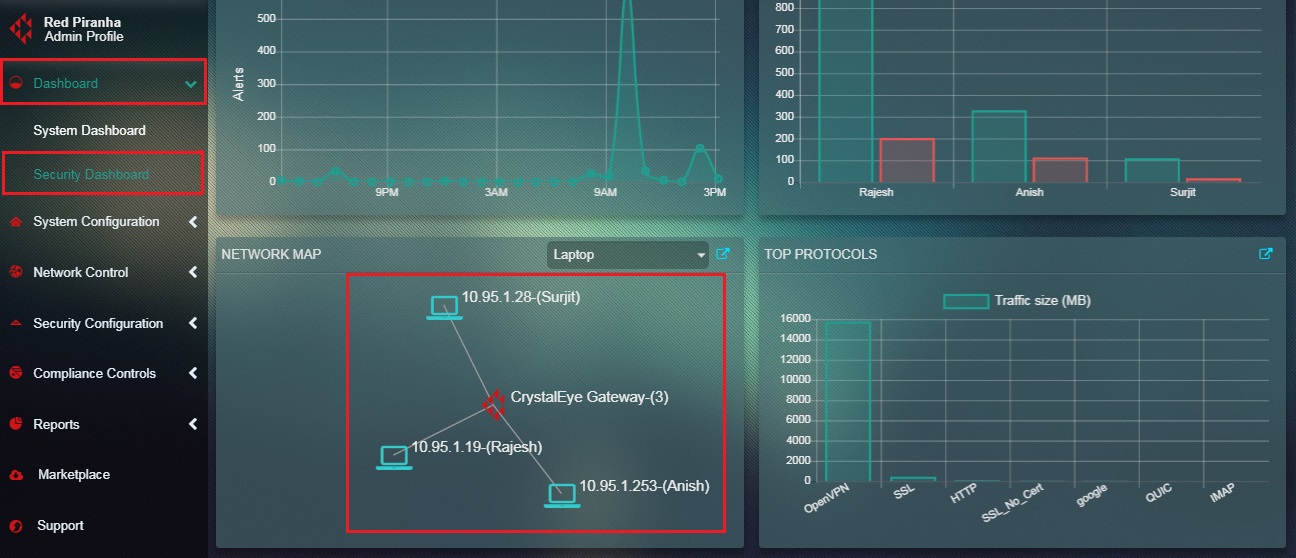
Note: In the above screenshot, there are three IP addresses of three laptops connected to the Crystal Eye network.
How to map a device on the Crystal Eye network with the help of the Network Map widget?
Mapping a device on the Crystal Eye network involves assigning a Username, Nickname, Vendor, IP Address, and the Device Type. This can also be done with the help of Crystal Eye’s Network Map application. Know more about how to map devices on the Crystal Eye network alternatively from the Network Map application.
Note: In the procedure discussed below we will map three unmapped laptops connected to the Crystal Eye network.
Step 1: In the Security Dashboard, select Unmapped from the dropdown on the top panel of the Network Map widget.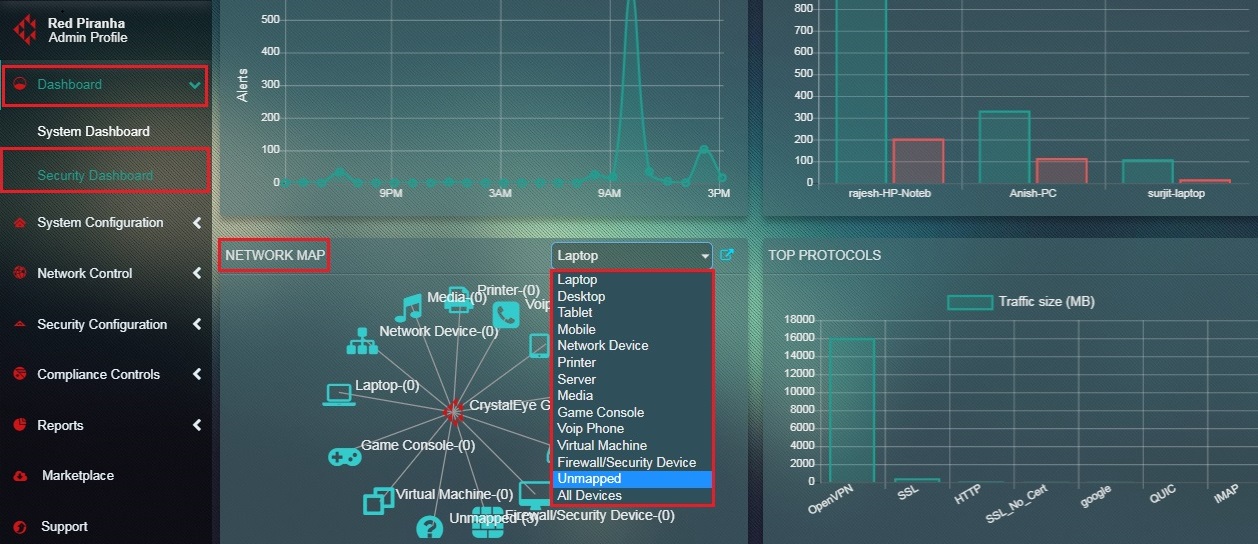
Step 2: You will now see the IP address of all the unmapped devices connected to the Crystal Eye network with a question mark icon next to it.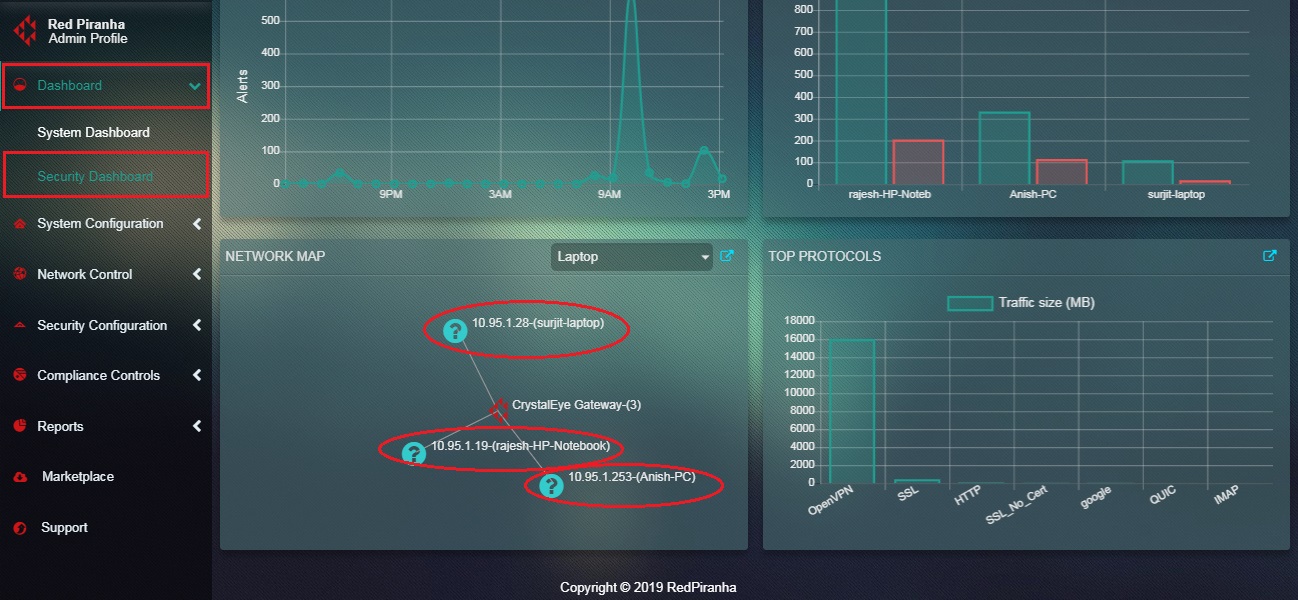
Step 3: Click the device IP address which requires to be mapped.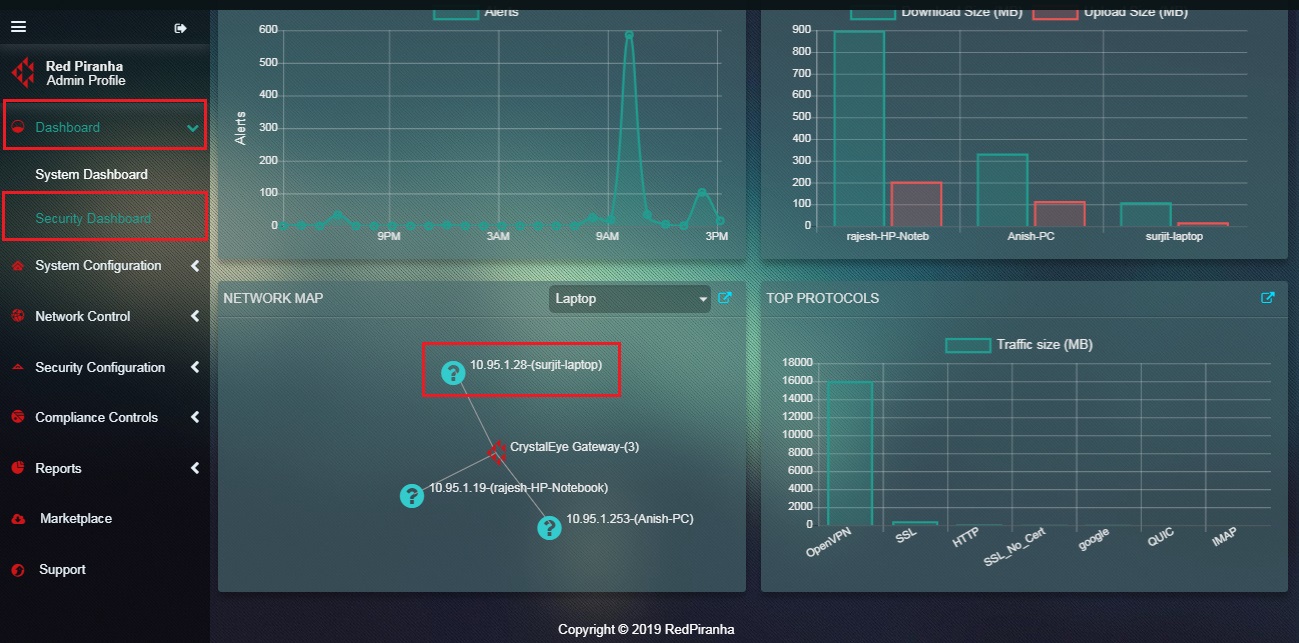
Note: In the above screenshot we have clicked 10.95.1.28 (surjit laptop).
Step 4: You will now see a Select Action pop-up. Click the Edit/Map Device button.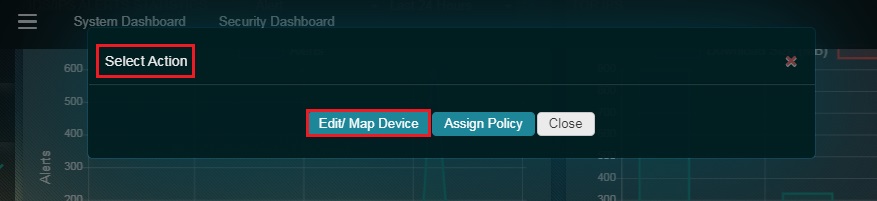
Step 5: You will now be directed to the Map Device pop-up. Assign the Username, Nickname, Vendor (of the device), IP Address, and Device Type and click the Add button. 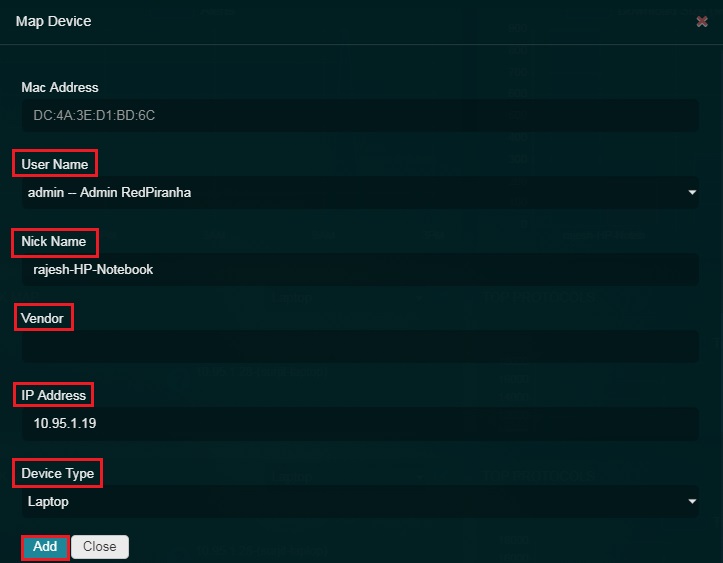
How to assign a content filter policy to a particular device from the network map widget in the security dashboard?
Note: Apart from the Network Map widget, the content filter policy can also be assigned to a particular device in the Crystal Eye network from the Network Map application and the Content Filter application.
In the steps mentioned below, we have already mapped the laptop device that requires a content filter policy assigned to it.
Step 1: In the Security Dashboard, select Laptop from the dropdown in the top panel.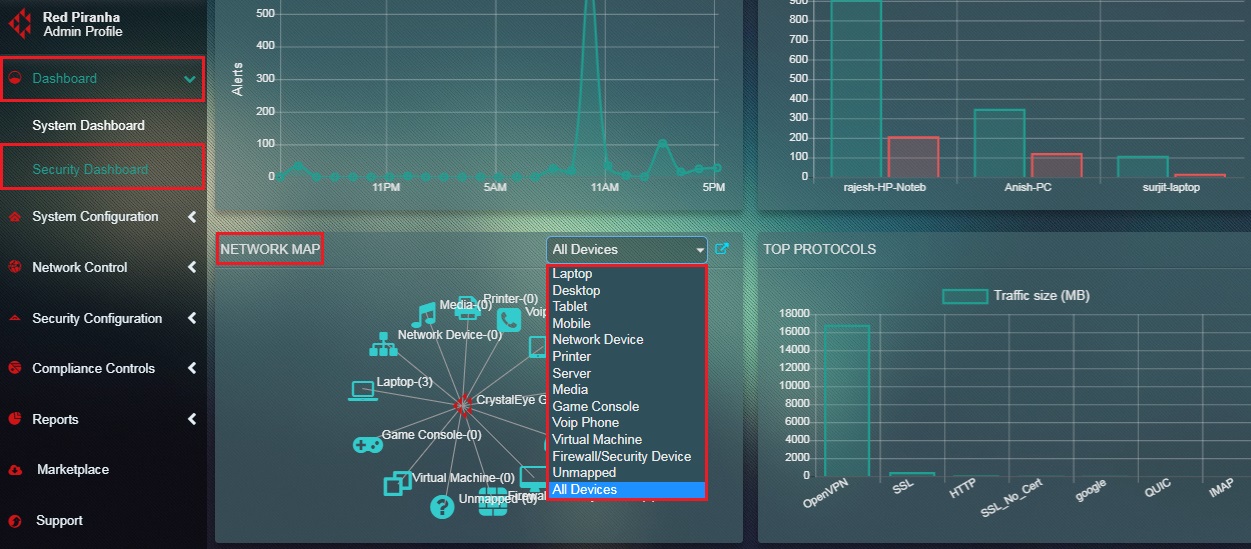
Step 2: You will now see the IP address and device name of all the devices connected to the Crystal Eye network.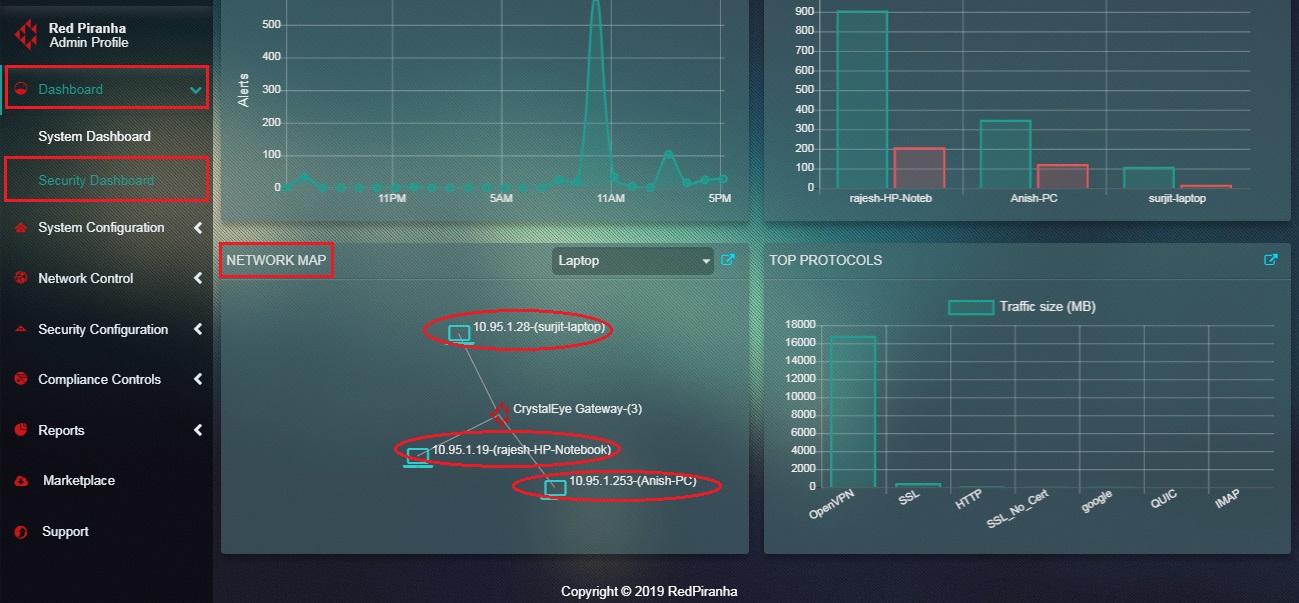
Step 3: Click the device on the Network Map widget for which you wish to assign the content filter policy. 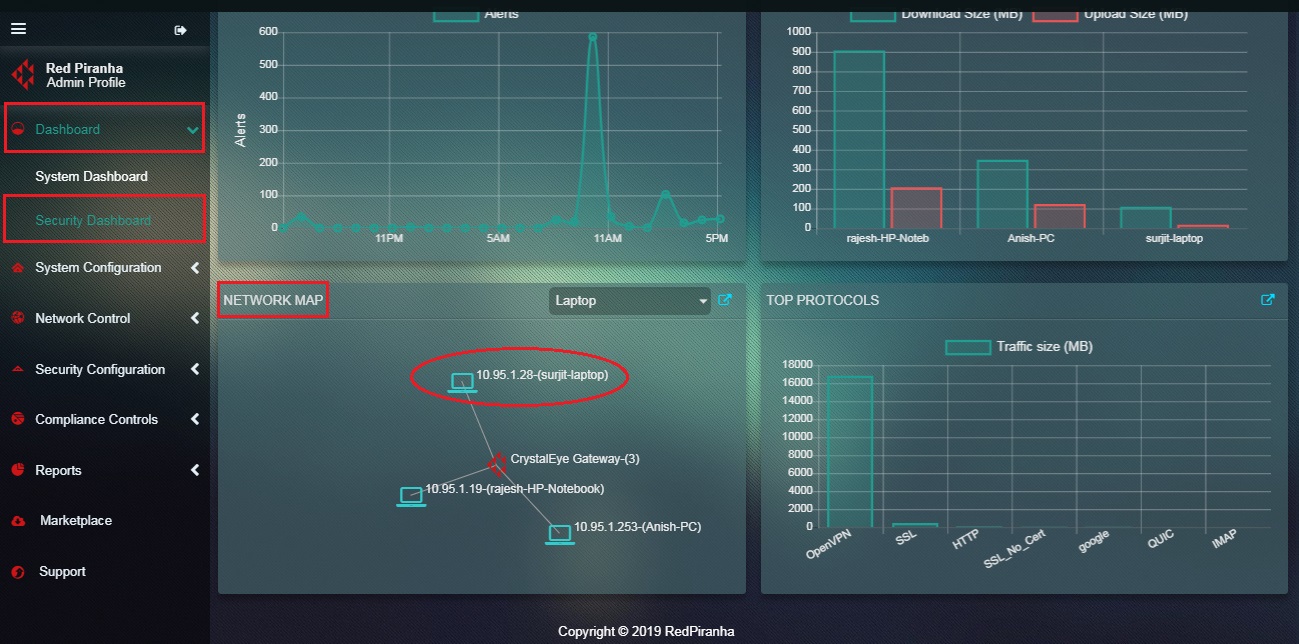
Step 4: You will now see the Select Action pop-up. Click the Assign Policy button. 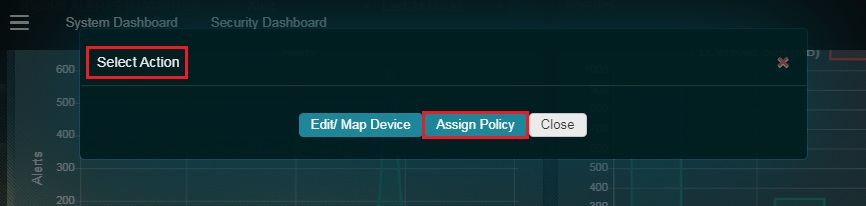
Step 5: You will now be directed to the Edit Content Filter Policy pop-up. Select the Policy Type from the dropdown and click the Update button. 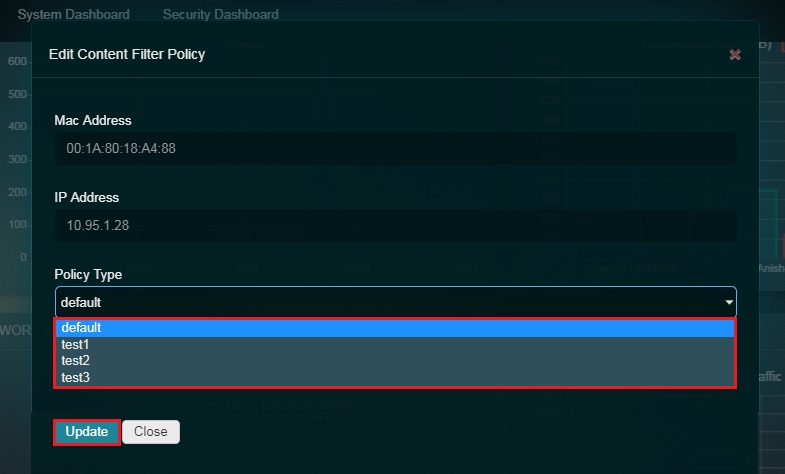
The Top Protocols widget in the security dashboard summarizes and displays the traffic size related to a particular protocol. Knowing the traffic size handled by a protocol in the Crystal Eye network helps the CE administrator to better understand the traffic and from where it’s originating.
Note: The information related to the traffic size of data transferred is categorized as per protocols used by devices in the CE network. A detailed report covering this aspect can be fetched from the Protocol Detail Report under the Reports section. The CE administrator can also know the device names and the protocols used by these devices. Similarly, the traffic can be further classified using the report data section and all of this can be downloaded in the PDF format.
How to interpret the data in the Top Protocols widget of the Security Dashboard?
The Top Protocols widget shows the traffic size from a particular protocol. 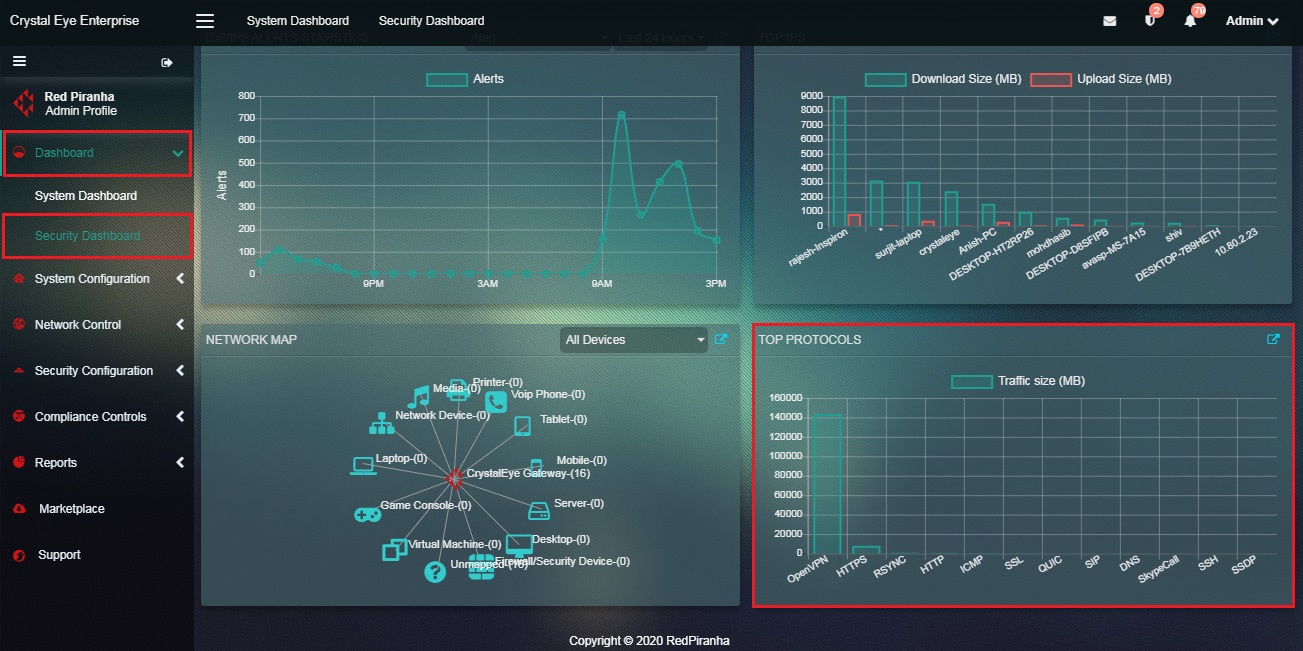
In the above graph, the information related to the traffic size is depicted in the bar graph. These bar graphs are aligned with a particular protocol. The CE administrator can easily know the amount of data packets transferred pertaining to a particular protocol. For instance in the above screenshot, the traffic size related to OpenVPN protocol is 143619 MB.