Network Diagnostic Tool
The Network Diagnostic Tool app provides option to the administrator to access some frequently used networking tools like ping, tracepath and route. The app is built to provide all networking related information to the administrator. These tools are widely used to find causes of glitches in the network interface. The Network Diagnosis Tool provides enhanced capabilities to Ping so as to analyze the host check whether it’s responding. The tracepath functionality is used by administrators to trace the journey of a data that it undertakes to reach the designated destination. In order to view the routing table, the administrator can use the View Route functionality. The routing table gives insights on important networking parameters such as, Destination, Gateway, Genmask, Flags, Metric, Ref, Use and Iface.
The Ping feature of the Network Diagnostic Tool app analyzes a remote host and checks whether it’s responding and alive to ICMP packets. The feature is pretty basic, and also includes the functionality that allows the administrator to determine and control the number of set packets set while pinging.
Note: Ping in itself is a Linux command. However, an administrator can run a ping command with the help of Ping functionality directly from the graphic user interface of crystal eye.
How to Use Ping Feature of Network Diagnostic Tool?
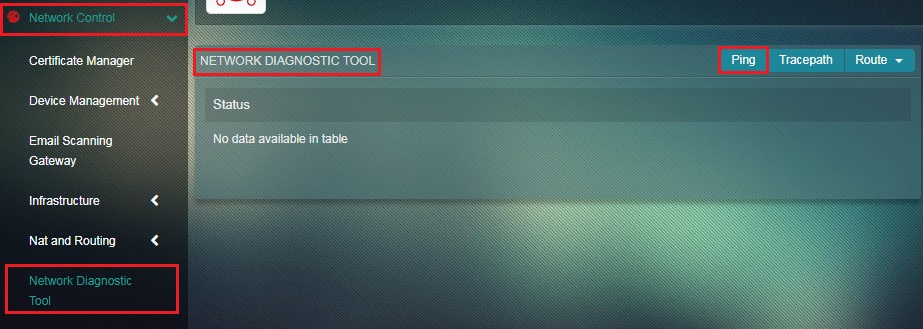
Step 1: In the Network Diagnostic Tool app page, click the Ping button.
Step 2: You will be directed to the Set Ping Parameter page. Select the Number of Response Packets required from the dropdown, enter the IP address of the remote host in the Set IP textbox and click the Execute button.
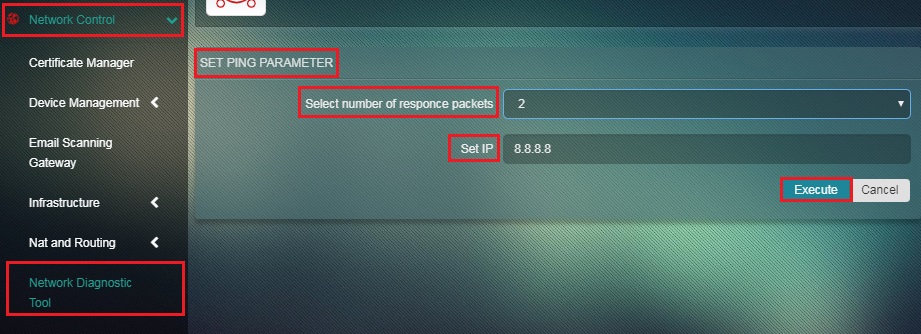
Note: The administrator can select the number of response packets to be 1, 2, 3, 4, 5
The Tracepath functionality of the Network Diagnostic Tool app is used by administrators to trace the journey of a data that it undertakes to reach the designated destination. This functionality can be used to detect various servers through which the data packet passes and shows each hop in the network. Tracepath scan details can be analyzed to identify slow points that affect the network connection and speed in a negative manner.
Note: Tracepath in itself is a Linux command. However, an administrator can run a Tracepath command with the help of the Tracepath functionality directly from the graphic user interface of Crystal Eye.
How to Use the Tracepath Feature of the Network Diagnostic Tool?
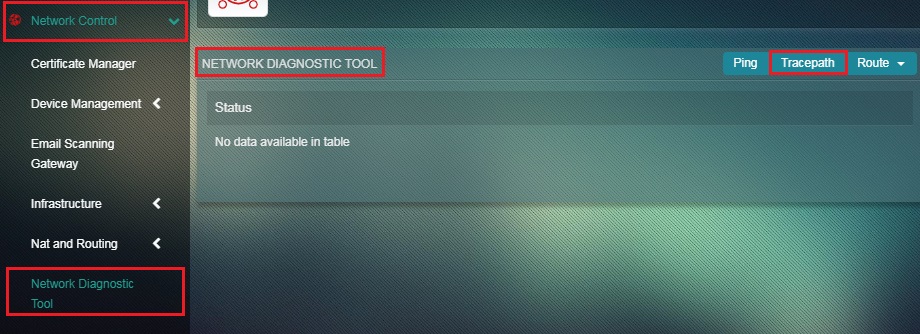
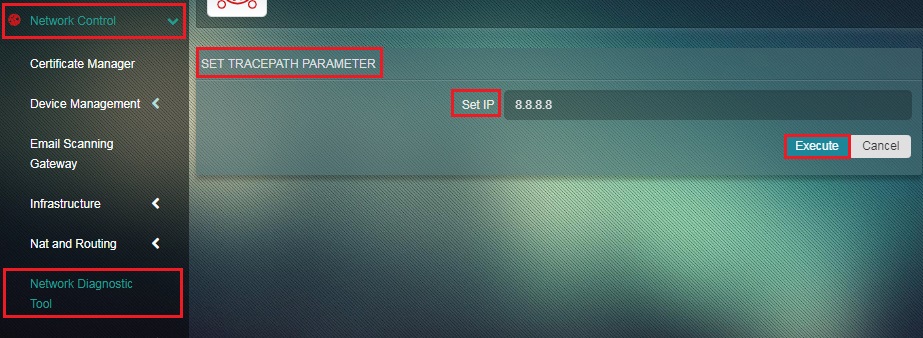
Step 1: In the Network Diagnostic Tool app page, click the Tracepath button.
Step 2: You will now see the Set Tracepath Parameter page. Enter the destination IP in the Set IP textbox and click the Execute button.
The Route functionality of the Network Diagnostic Tool app is used by administrators to view and make amendments in the kernel routing table. Using this functionality the administrator can View Route, Add Route, Delete Route, Add IP Route and Delete IP Route.
The network traffic is forwarded to a designated destination with the help of a router. The router performs the function of determining the routing process of data packets and sends it to its destination. The entire decision making process of the router is documented in Routing Tables. These routing tables basically show the journey of the data packets from the Source to destination.
The Routing Table can be viewed using the View Route functionality of the Network Diagnostic Tool app. On executing this functionality, the administrator would be able to view the routing table. The routing table shows the information about the journey of the data packets from source to destination. This information is shown in a tabular format.
While examining routing table administrators would come across the following fields:
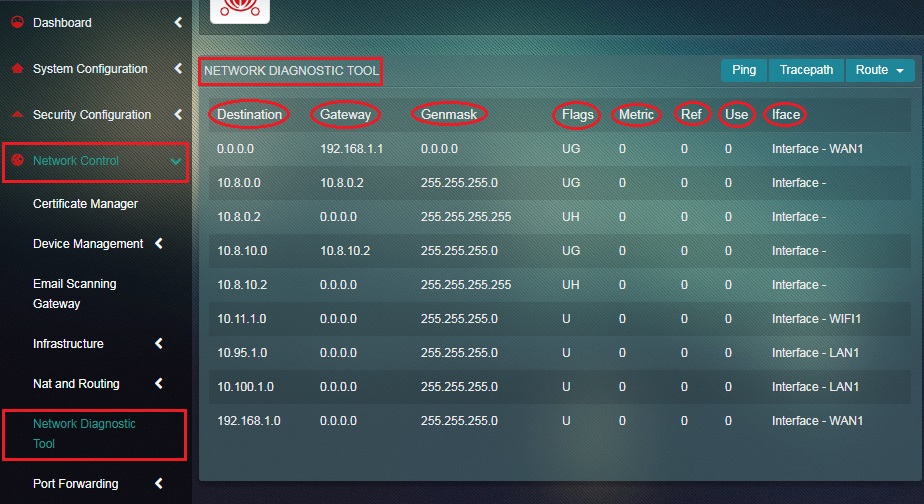
- Destination – This column shows all the network hosts that a router is attached to.
- Gateway – When a data packet is sent to its destination it first reaches the router. The router looks for the gateway listing and the gateway listing finally tells the which IP address the packet must be forwarded to reach its destination.
- Genmask - The netmask for the destination net; '255.255.255.255' for a host destination and '0.0.0.0' for the default route.
- Flags – The flags are status represented alphabetically. Possible flags might include, U (route is up), H (target is a host), G (use gateway), R (reinstate route for dynamic routing), D (dynamically installed by daemon or redirect), M (modified from routing daemon or redirect), A (installed by addrconf), C (cache entry) and ! (reject route)
- Metric – It basically shows the distance from the origin to the destination represented numerically. For example: if the Metric is 100 it means that there is 100 hops until the data packet reaches the destination.
- Ref - It shows the number of reference to the route and is denoted numerically.
- Use – This column shows the count of lookups in the route.
- Iface – It shows the interface of the destination the packet will be sent to in the route.
How to View Route?
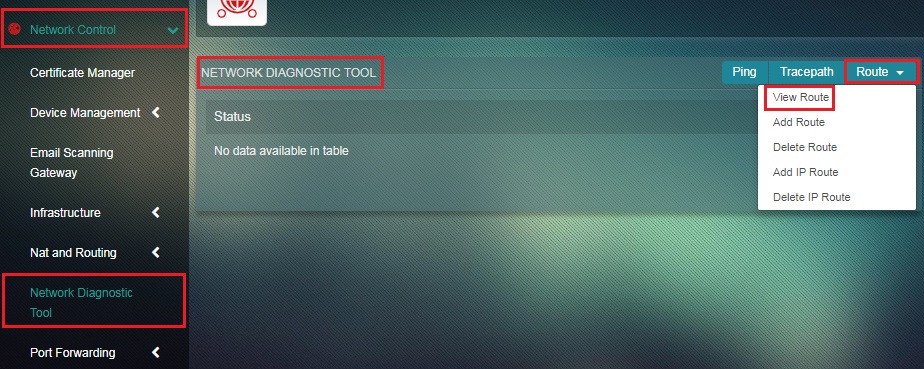
Step 1: In the Network Tool Diagnostic app page, select View Route from the Route dropdown.
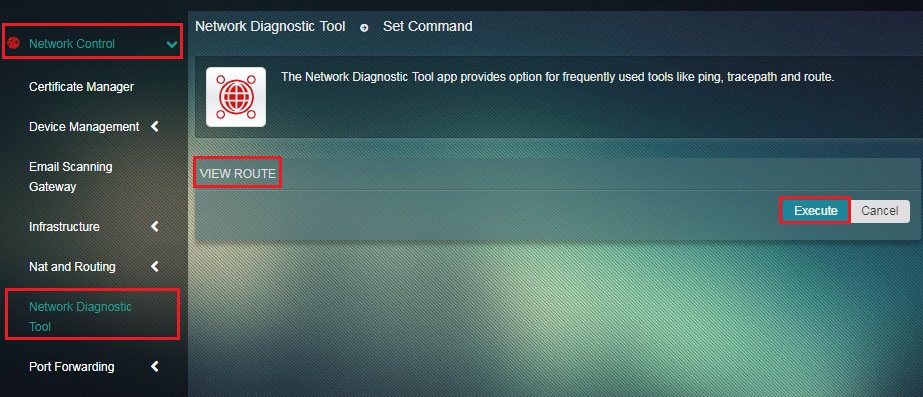
Step 2: You will now see View Route page. Click the Execute button.
The Network Diagnostic tool app will now display the journey of the data packets from source to destination. Parameters such as Destination, Gateway, Genmask, Flags, Metric, Ref, Use, Iface will now be available for further analysis. The following screenshot shows the routing path of the data packets.
The Add IP Route functionality of the Network Diagnostic Tool app enables the administrator to add a destination IP and assign a designated gateway IP for it. In order to use this functionality effectively, the administrator will have to provide the Network IP Address (Destination IP), Netmask Value, Gateway IP Address, and the Interface (this is the exit interface from where packets will leave to another network).
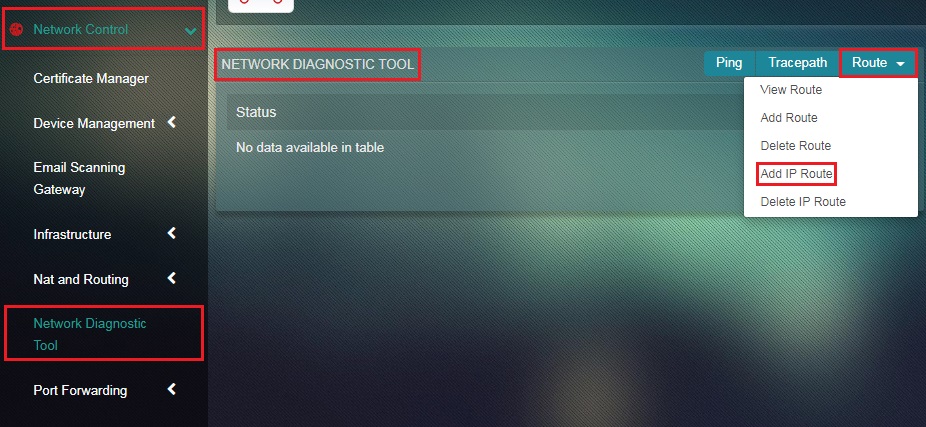
How to Add IP Route?
Step 1: In the Network Diagnostic Tool app page, select Add IP Route from the Route dropdown button.
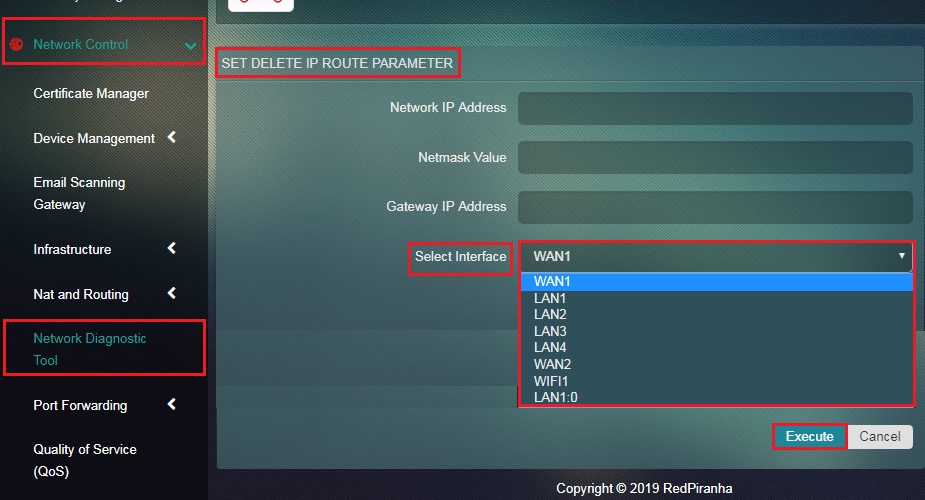
Step 2: You will now see the set IP Route Parameter page. Enter the Network IP Address, Netmask Value, and Gateway IP Address.
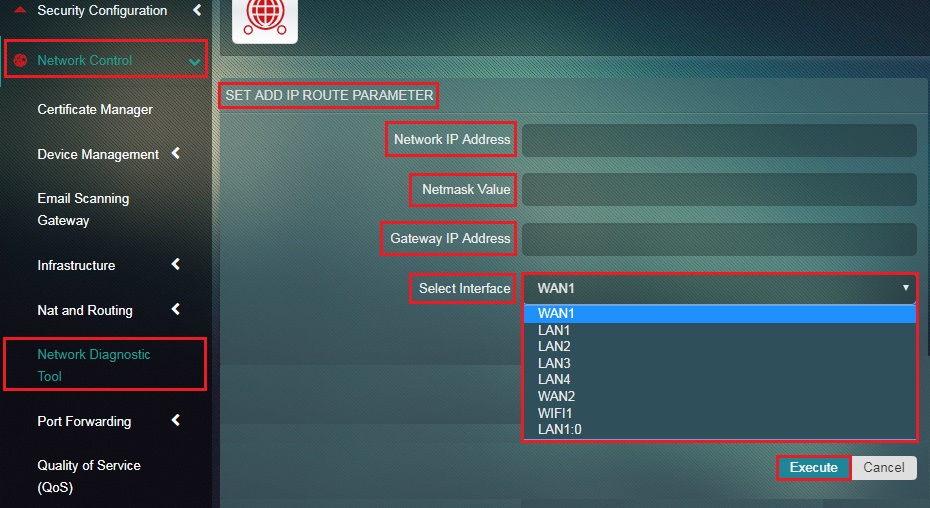
Step 3: Select the Interface (this is the exit interface from where packets will leave to another network) from the dropdown and click the Execute button.
The Delete IP Route functionality of the Network Diagnostic Tool app enables the administrator to delete a route from the routing table. In order to use this functionality effectively, the administrator will have to provide the Network IP Address (Destination IP), Netmask Value, Gateway IP Address, and the Interface (this is the exit interface from where packets will leave to another network).
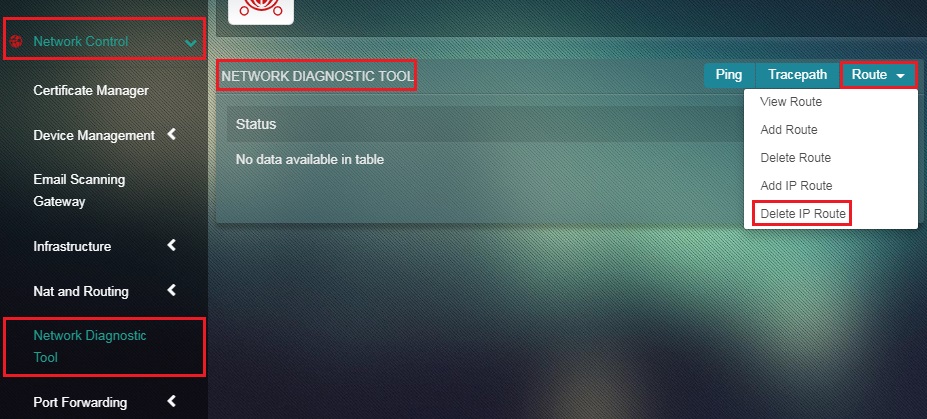
How to Delete an IP Route?
Step 1: In the Network Diagnostic Tool app page, select Add IP Route from the Route dropdown button.
Step 2: You will now see the set IP Route Parameter page. Enter the Network IP Address, Netmask Value, and Gateway IP Address.
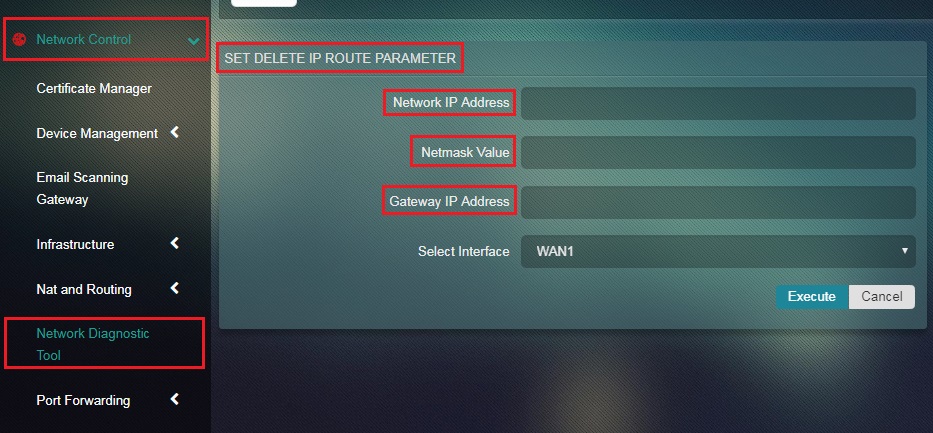
Step 3: Select the Interface (this is the exit interface from where packets will leave to another network) from the dropdown and click the Execute button.