IP Attack Map
The IP Attack Map application comprises of 6 main components that sums up to render a pool of data utilized for detailed security analysis. The IP attack map displays data pertaining to the security zones of the Crystal Eye network through the Banned IPs Table, Real Time Attack Tracker, Protocol Traffic Size Indicator, Device Traffic Size Indicator, Alert Report, and Alert Analysis. 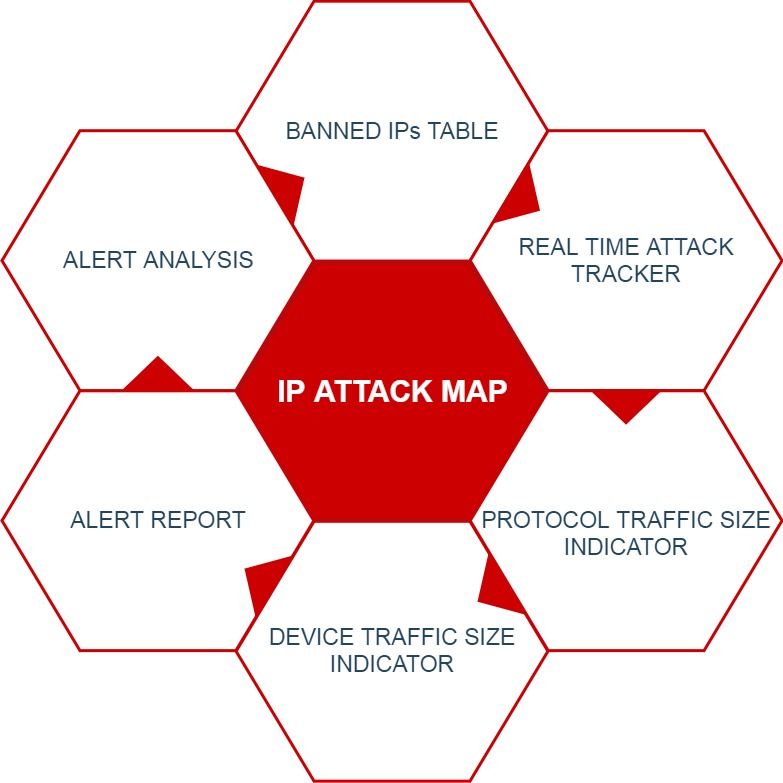
The data gathered becomes the basic platform facilitating in-depth security analysis. The attack is visually depicted on the world map clearly specifying the origin and the destination of the attack. The visual depiction of the attack is also colour coded to specify the protocol that was used in the attack. All this is simulated on the world map and has a parallel database called the Alert Report which further provides the attack details such as the Timestamp, Source IP, Destination IP, Country Name, Region Name etc.
In the screenshot below, an attack is depicted in the world map specifying its origins in Argentina. The attack is color coded as orange which means SSH protocol was used. The visual depiction on the world map can also be co-related with the corresponding Alert Report below the map where the attack details are mentioned. 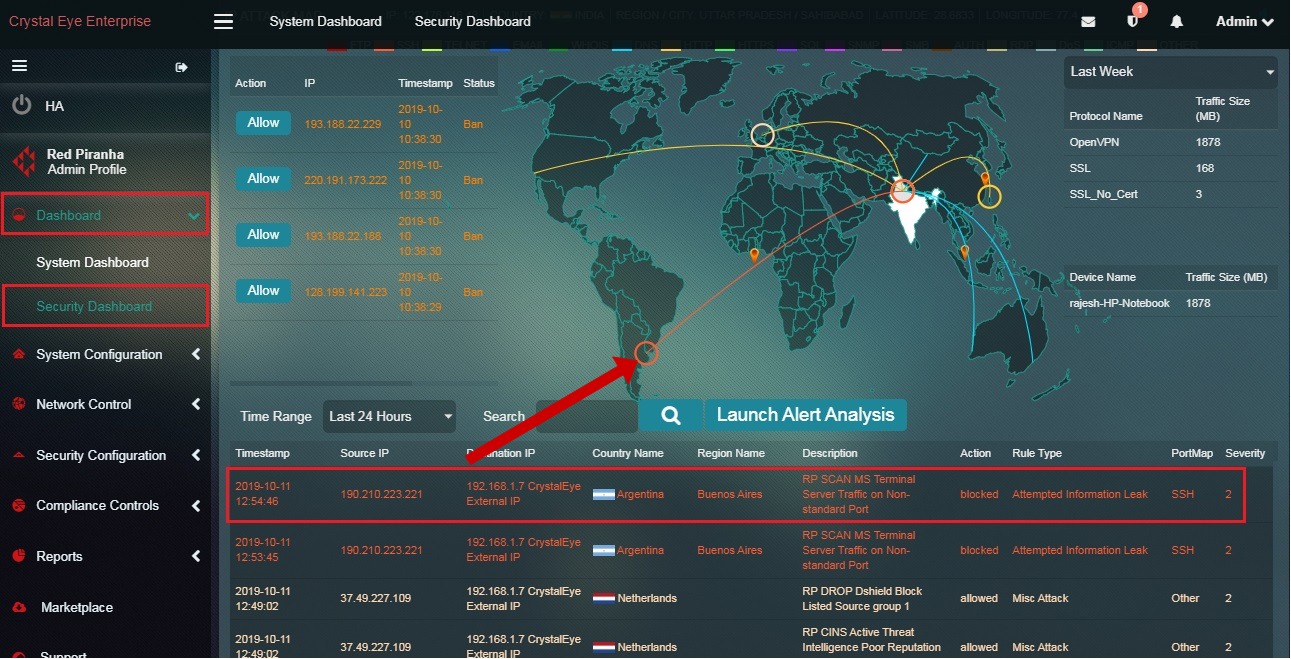
Every attack that is detected and simulated in the IP attack map is triggered by pre-configured IDS/IPS rules updated by Red Piranha’s Security Operations Team. These IDS/IPS rules can be modified or can be escalated to RP’s security operations team if there is a requirement to review them.
Note: The CE administrators can have access to all features of the IP Attack Map application from the Security Dashboard as well. However, the IP Attack Map PDF report can only be attained from the IP Attack Map application.
Left-hand Navigation Panel > Reports > IP Attack Map Application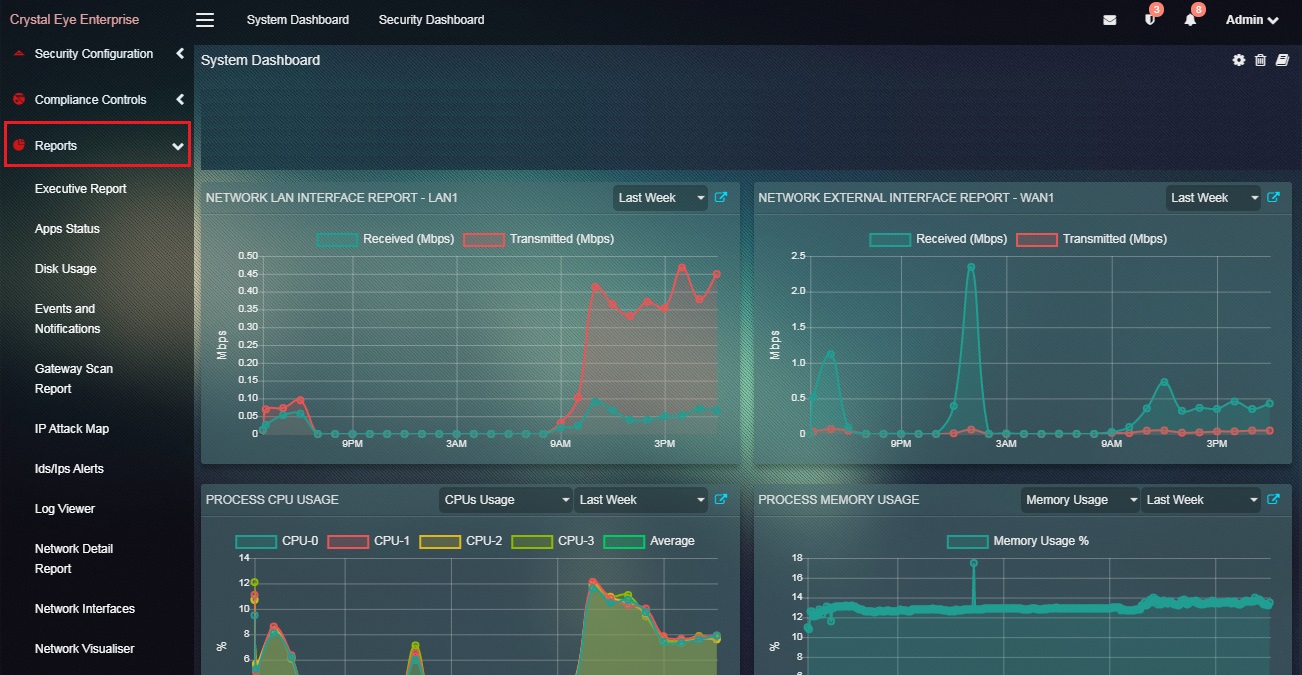 |
|---|
The Crystal Eye appliance bans any IP address that exceeds the login attempts threshold while accessing the CE itself. Once the IP address is banned the details are displayed in the Banned IPs Table with the Timestamp, Country Name and Region Name. If the CE administrator wishes to allow or whitelist a banned IP it can be done with a click of a button.
The forcefield feature of Crystal Eye plays the role of safeguarding the CE itself by blocking IPs that exceeds the login attempt threshold. The CE administrator can download a PDF report having information about the list of IPs that has been blocked by the Forcefield application.
Note: The Banned IPs can be whitelisted or allowed from the IP attack map in the security dashboard. While a customized report of these IPs can be downloaded from the Log section of the Forcefield application.
How to Whitelist or Allow a Banned IP Address?
Step 1: In the IP Attack Map application page, click the Allow button in the Banned IPs Table.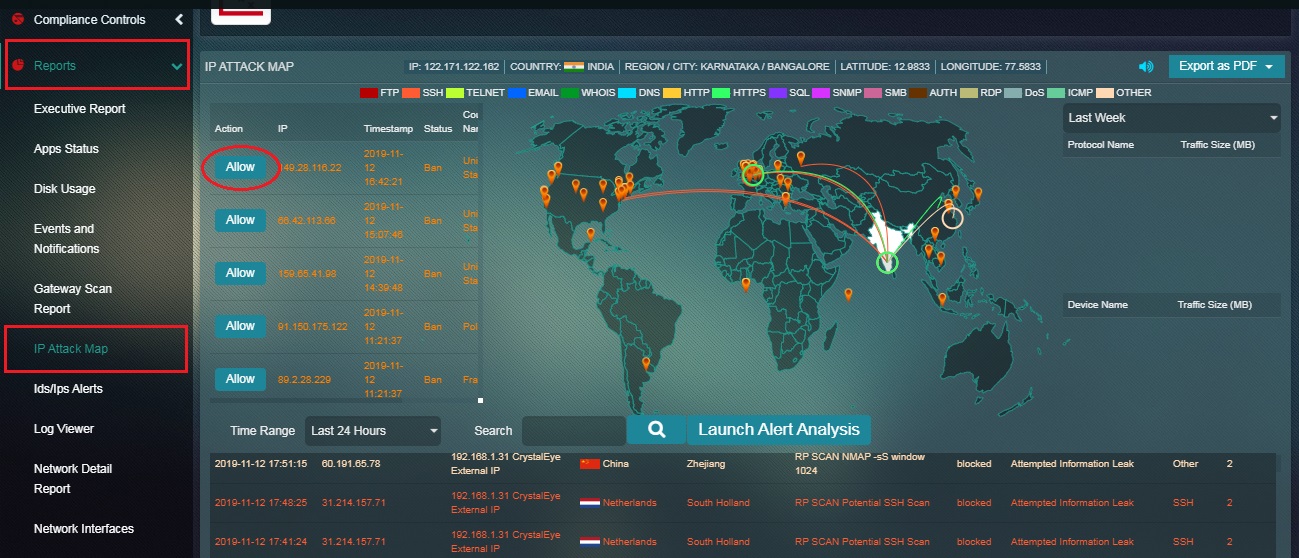
The Real-time Attack Tracker displays a well summarised simulation of the incoming attacks on a world map. It shows the origins of the attack and also specifies the target. The graphical attack simulations are IDS/IPS alerts that have been triggered by pre-configured rules. The protocol used during the attack can be detected as they are colour coded (example: red is FTP, Yellow is TELNET etc). Some of the attack protocols that are detected and displayed here are FTP, SSH, TELNET, EMAIL, WHOIS, DNS, HTTP, HTTPS, SQL, SNMP, SMB, AUTH, RDP, DoS, and ICMP. If the attack protocols are different from the ones mentioned above then it would be recorded under ‘others’.
How to Interpret the Data Shown in the Real-Time Attack Tracker?
Step 1: In the IP Attack Map application page, observe an attack simulated in the world map (the attack observed in the screenshot below is circled in red).

Step 2: Now observe the corresponding entry of the attack in the alert table.!

Note: In the above screenshot, the Alert Table shows the time and date of the attack, the origin, the destination IP of the attack, country of origin, region name, description, action, rule type, port map and severity.
The Protocol Traffic Size Indicator shows the size of the data transferred using a particular protocol. The Crystal Eye appliance detects the protocol and automatically calculates the traffic size transferred over a period of time and displays it in a tabular format. The traffic size is measured in Megabytes (MB).
Note: The Protocol Traffic Size Indicator showing the size of the incoming and outgoing traffic pertaining to a particular protocol can be viewed in the Security Dashboard under the IP Attack Map and in the Top Protocols section of the Protocol Detail Report application.
How to Locate the Protocol Traffic Size Indicator in the IP Attack Map application?
Step 1: In the IP Attack Map application page, you will find the Protocol Traffic Size Indicator in the top-right corner.
Note: Apart from the IP Attack Map application, the top traffic size with respect to the protocol used can also be viewed in the IP Attack Map section under Security Dashboard and Top Protocols section of the Protocol Detail Report application.
The Device Traffic Size Indicator shows the device name (as mapped with CE) and the amount of data that it had received and sent over a period of time. The Device Traffic Size is measured in Megabytes (MB). How to Locate the Device Traffic Size Indicator in the IP Attack Map application?
Step 1: In the IP Attack Map application page, you will find the Device Traffic Size Indicator in the top-right corner.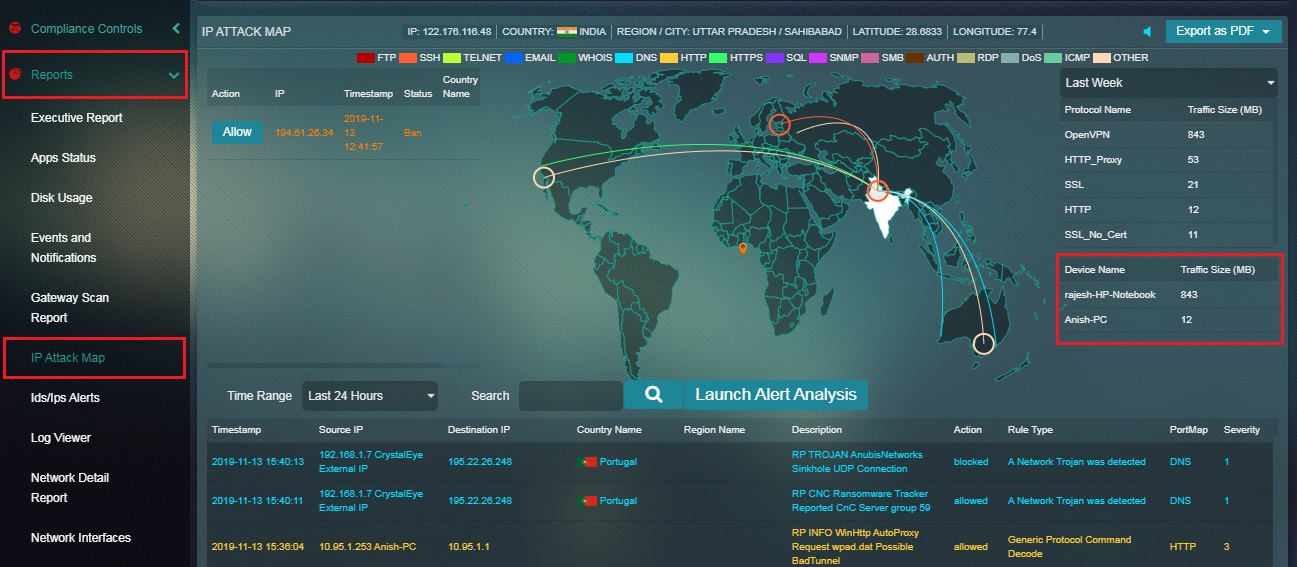
Note: Apart from the IP Attack Map application, the top traffic size transferred and received by devices in the CE network can also be viewed in the Top Devices section of the Protocol Detail Report application and the Security Dashboard.
The IDS/IPS Alert Report displays attack specific data also known as IDS/IPS alerts generated on a real-time basis. These attacks and the protocols involved are visually depicted in the Real Time Attack Tracker. When an attack is initiated, the origin of the attack and the target CE network is visually depicted in the Real Time Attack Tracker. The Crystal Eye administrator can also view elaborated details of the attack such as the source IP, destination IP, country (from where the attack originated), region name, description of the attack, severity etc in the IDS/IPS Alert Report.
The above screenshot depicts that there was an attack that originated from Argentina and was targeted towards a network secured with Crystal Eye in India. The attack is denoted in the map and its corresponding details are also mentioned in the Alert Report.
Upon clicking a particular IDS/IPS alert the Crystal Eye administrator can view alert details, escalate an attack alert to Red Piranha’s Security Operation’s Team, and view the IDS/IPS rules that triggered the alert.
Note: The Alert Report can be viewed in the IP Attack Map section of the Security Dashboard and in the Inbox section and the Alerts section of the IDS/IPS Alerts application.
The Crystal Eye appliance displays various real-time alerts that can be viewed and analysed. The analysis process includes viewing the IDS/IPS Alerts and the rules that trigger these alerts. The real-time alert pops-up in the alerts report and is triggered by rules which can be converted to pass, drop, or reject. If a rule triggers too many false positives then the Crystal Eye administrator can also disable those rules as a part of the rules tunning process. The CE administrator also has the leverage to escalate an alert attack to Red Piranha’s security operations centre team.
We have discussed various ways to analyse IDS/IPS alerts below:
- How to view IDS/IPS alert details and the rules that triggers the IDS/IPS alert?
- How to convert the IDS/IPS rules to Drop, Pass or Alert after it triggers an attack alert?
- How to disable a particular IDS/IPS rule that triggered an IDS/IPS alert?
- How to escalate an attack alert to Red Piranha’s security operations centre team for analysis?
How to view IDS/IPS alert details and the rules that triggers the IDS/IPS alert?
Step 1: In the Security Dashboard, click any of the IDS/IPS alerts in the Alert Report section.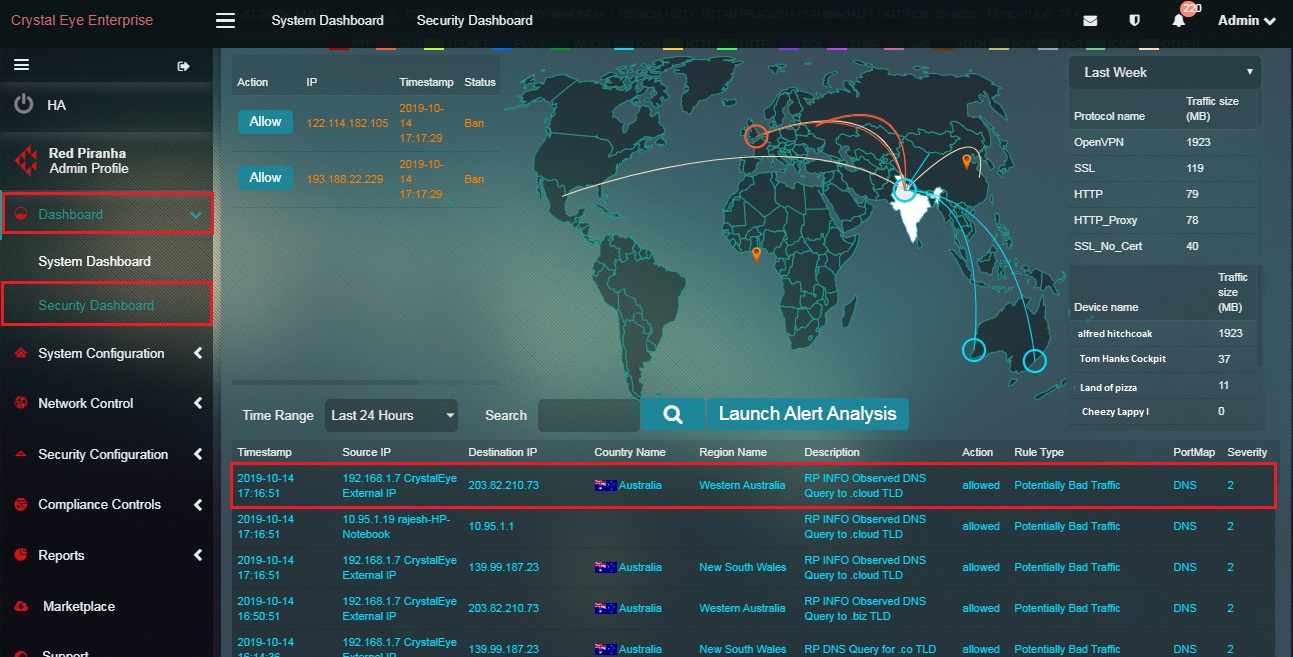
Step 2: You will now see a detailed report of the IDS/IPS alert details and the IDS/IPS rule details that triggered the alert.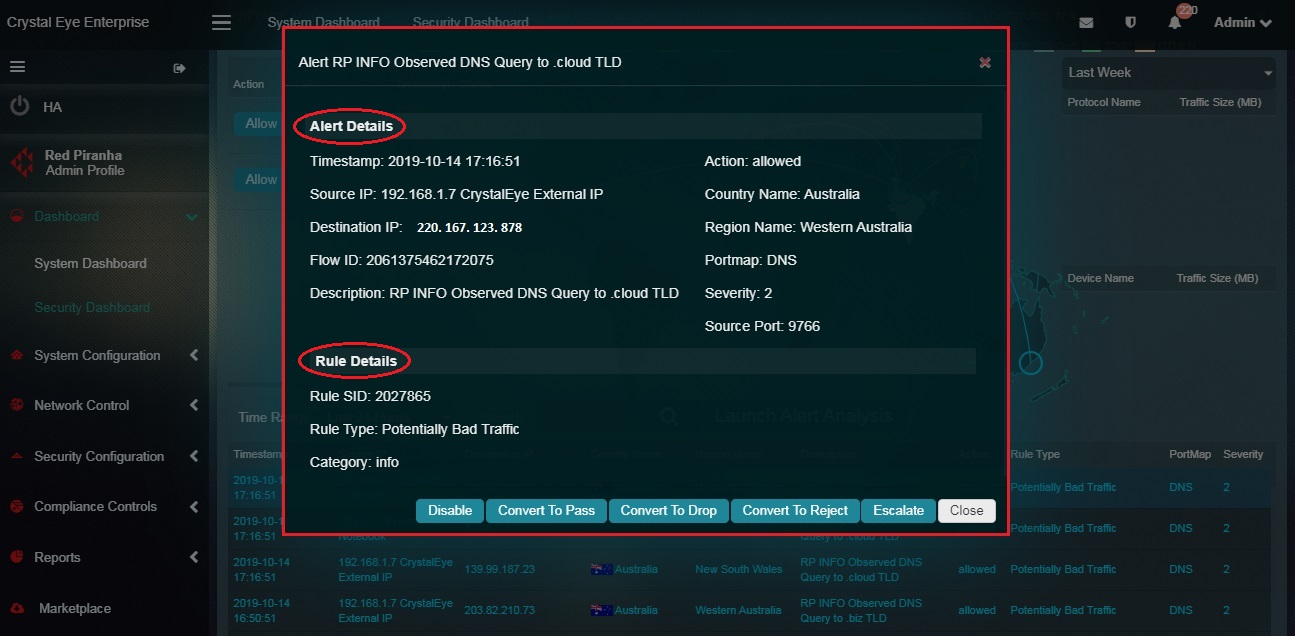
How to convert the IDS/IPS rules to Drop, Pass or Alert after it triggers an attack alert?
The IDS/IPS rule plays a vital role in stopping detected incidents that occur in the Crystal Eye network. However, the characteristics of these specially created rules can be changed.
These rules can be converted to Pass, Drop and Reject further defining the nature of the rules as discussed below.
Convert to Pass: Post conversion of the rule to Pass, if a signature matches, the packets are not scanned anymore, and the scanning process is skipped to the end of all rules for the current packet)
Convert to Drop: Post conversion of the rule to Drop, if a signature matches then the packet will be stopped and will not be allowed to move further into the network.
Convert to Reject: Post conversion of the rule to Reject, if a signature matches then the packet will not go through, and both the sender and receiver will receive a reject packet.
Step 1: In the Security Dashboard, click an IDS/IPS alert in the Alert Report. 
Step 2: You will now see a detailed report of the IDS/IPS alert details and the IDS/IPS rule details that triggered the alert.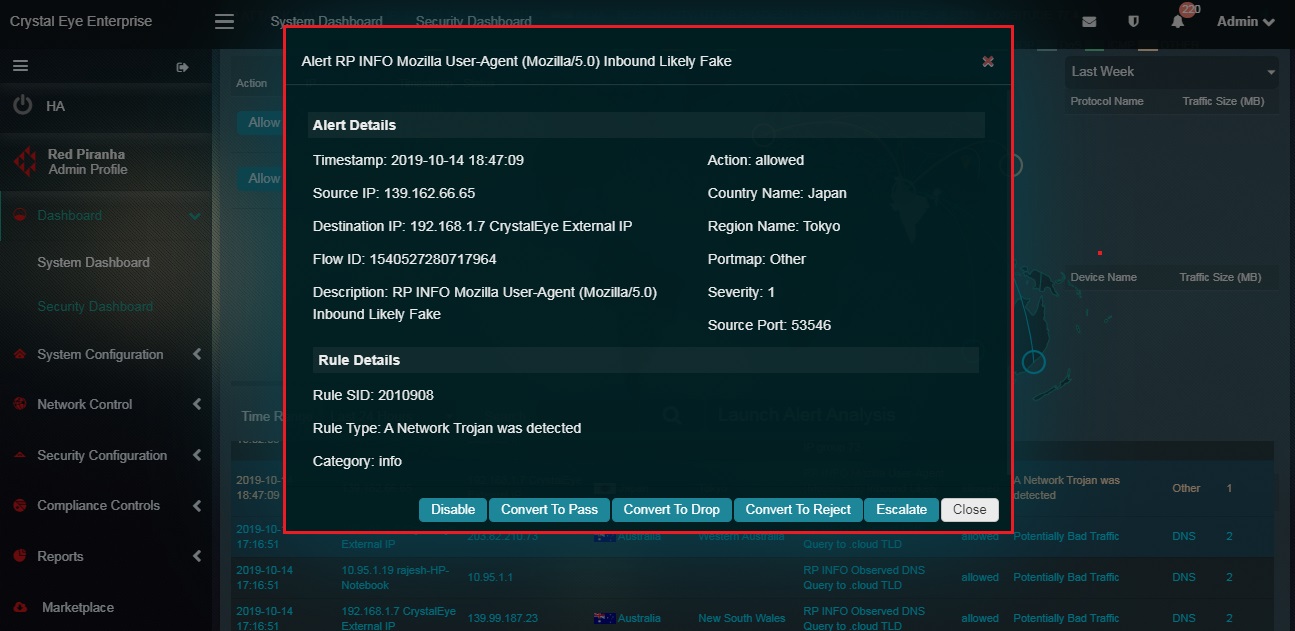
Step 3: Click Convert to Pass, Convert to Drop or Convert to Reject in the Alert Details pop-up. 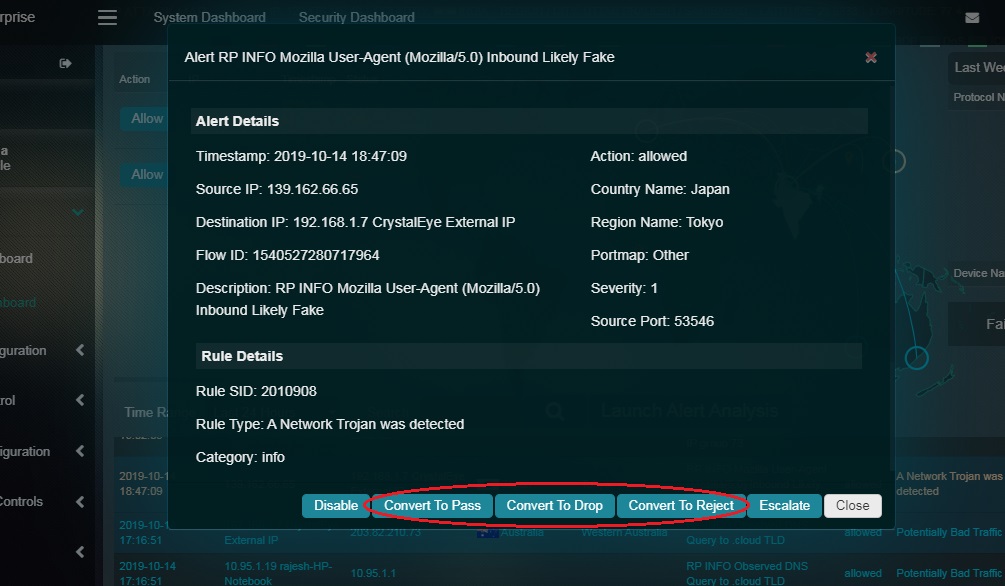
Note: If there is a requirement to dig in deeper to further analyse the IDS/IPS Alerts in detail then this can be done by hitting the Launch Alert Analysis button. You will then be directed to the IDS/IPS Alerts application where detailed PDF reports can be extracted for the purpose of analysis.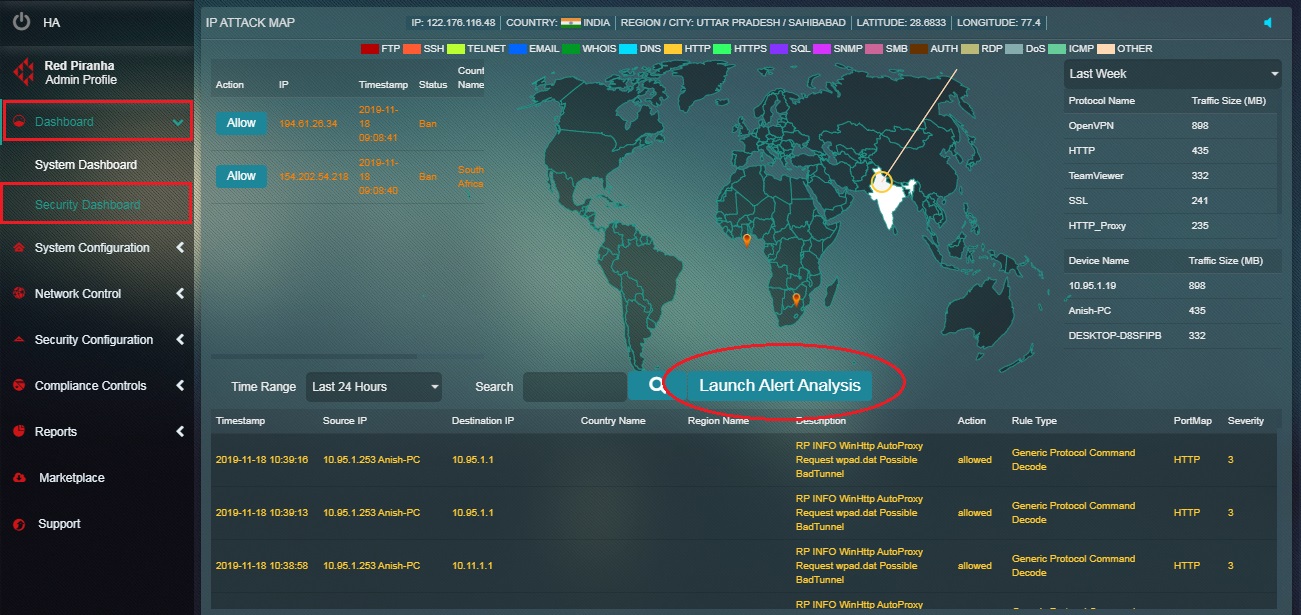
How to disable a particular IDS/IPS rule that triggered an IDS/IPS alert?
Crystal Eye administrator might come across situations when the IDS/IPS rule that triggered the alert must be disabled. In this case, the IDS/IPS alert must be clicked and then the disable IDS/IPS alert button must be clicked.
Step 1: In the Security Dashboard page, click the IDS/IPS alert for which the IDS/IPS rule needs to be disabled.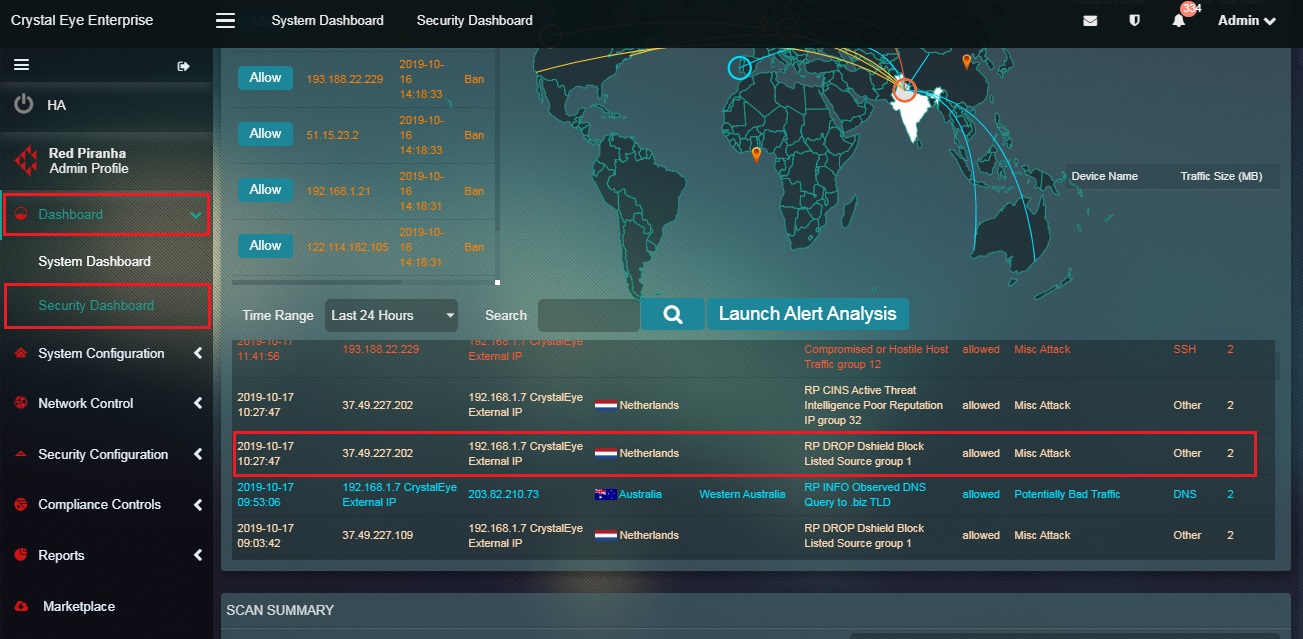
Step 2: You will now see the Alert Details and the Rule Details. Read the details and then click the Disable button.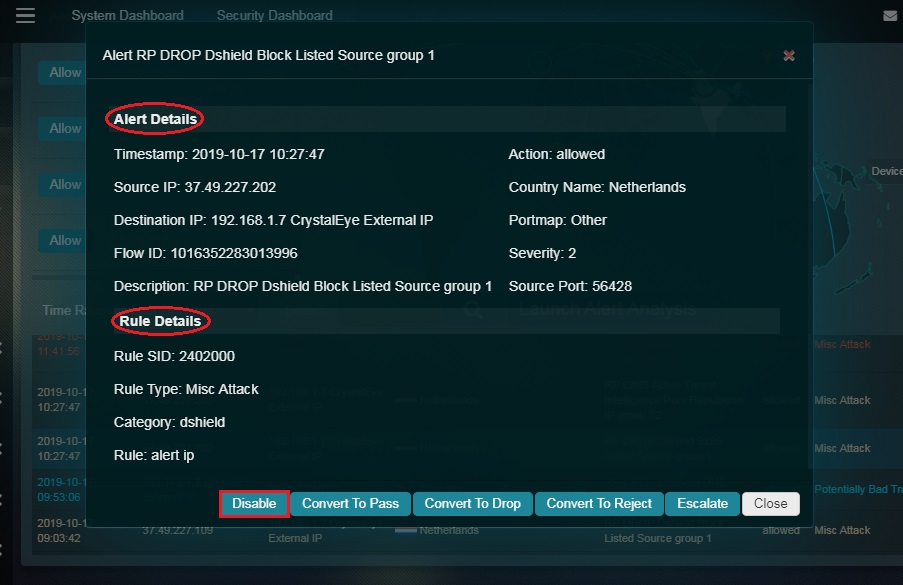
How to escalate an attack alert to Red Piranha’s security operations centre team for analysis from the IP Attack Map application?
All attack alerts can be escalated to the SOC team after Incident Response Services application is installed. Escalations will not be processed until the Incident Response Services application is installed and configured. The details of the alerts that are escalated are also mentioned in the Escalated Alerts section of the of the IDS/IPS Alerts application where a PDF report can also be generated for the same. Apart from IP Attack Map application, the IDS/IPS alerts can also be escalated to RP’s Secops team from the IDS/IPS Alerts Report section of the Security Dashboard and the Inbox Report section and the Alerts section of the IDS/IPS Alert application.
Click here to know how to configure Incident Response Services application.
Note: If the Incident Response Services application is not installed and configured then the following error message will be displayed. 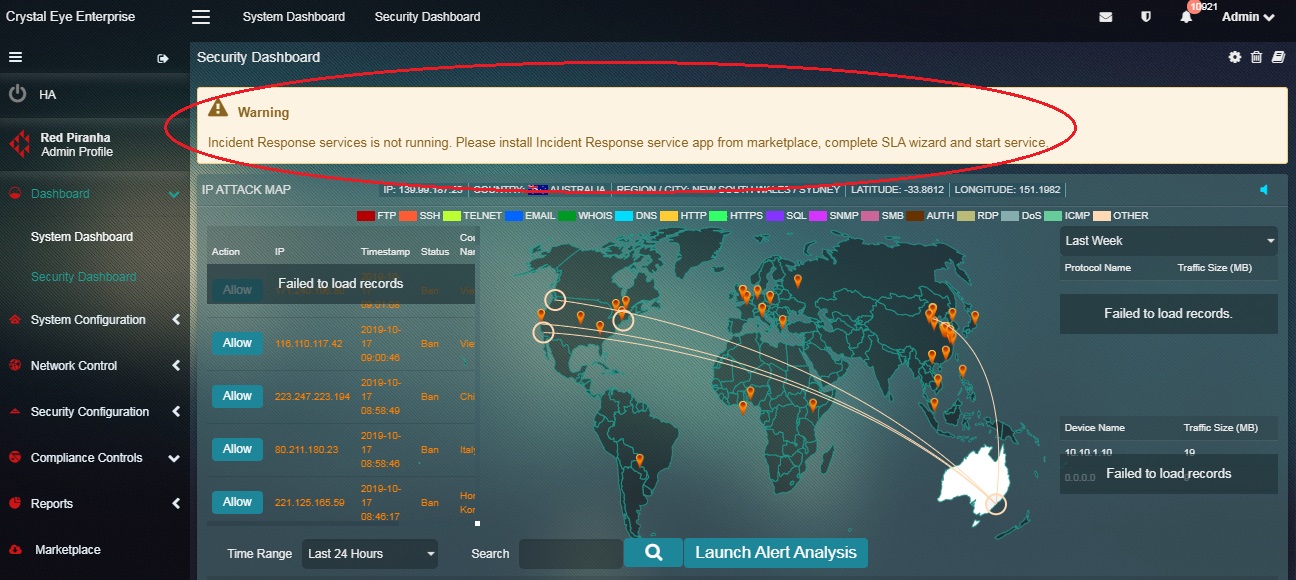
Step 1: In the Security Dashboard page, click the IDS/IPS alert that needs to be escalated.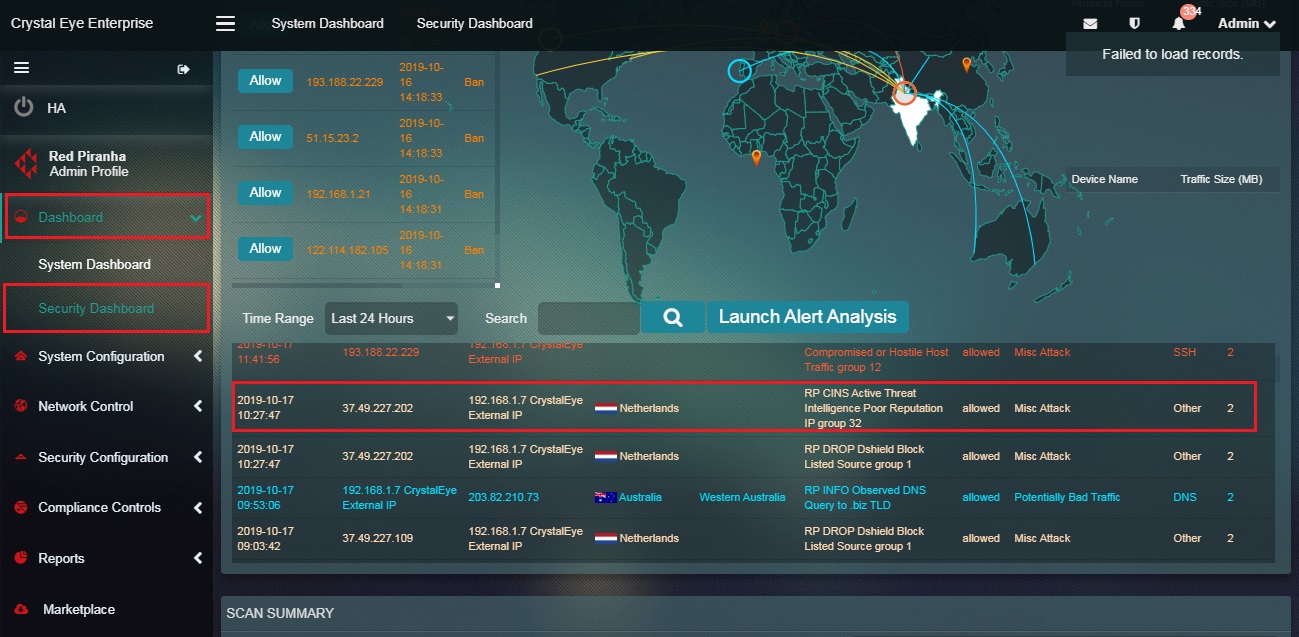
Note: Before you initiate the process of alert escalation to Red Piranha’s SOC team make sure that the Incident Response Services application is installed and configured. Click here to know how to configure the Incident Response Services application.
Step 2: You will now see the Alert Details and the Rule Details. Read the details and then click the Escalate button.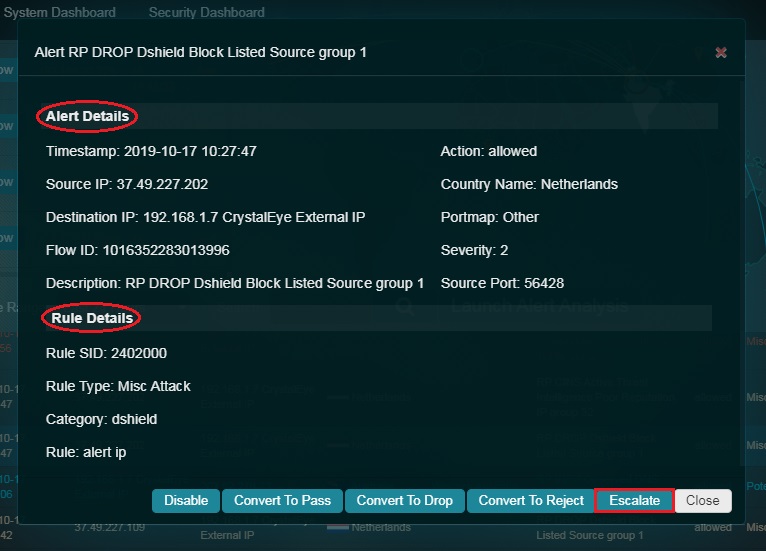
Step 3: You will now see a Comment Box. Add the comment and click the Submit button.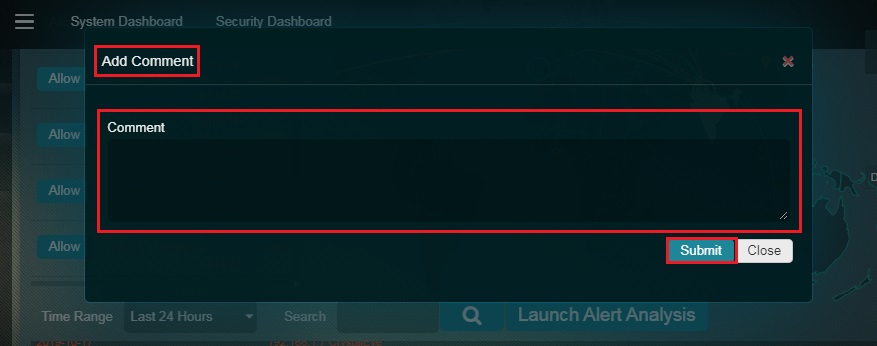
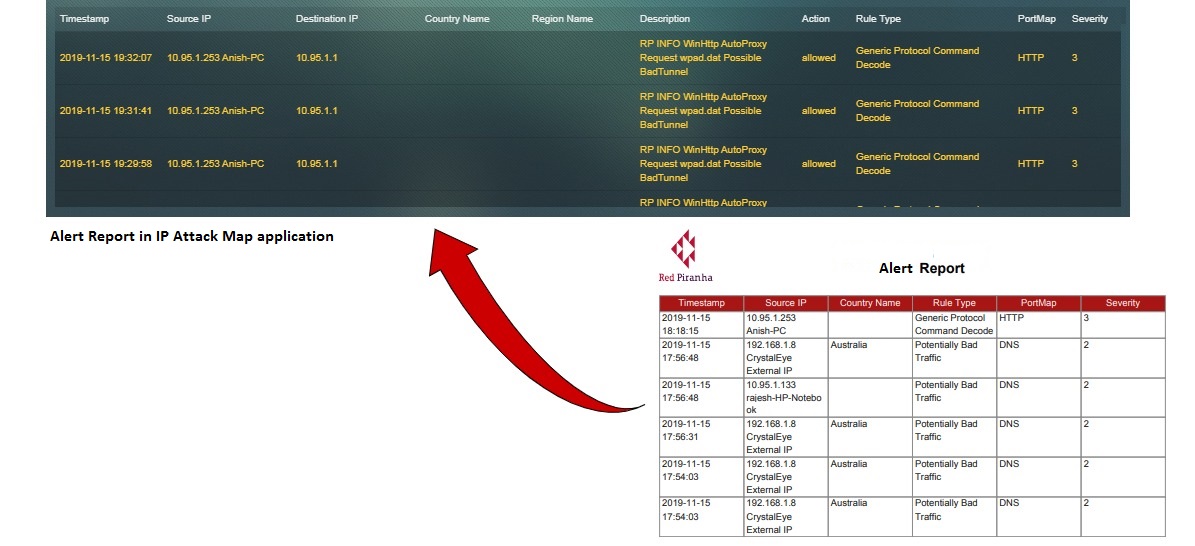
A Crystal Eye administrator can download IP Attack Reports covering various parameters related to security analysis. The key components of this report are Protocol Traffic Size Indicator, Device Traffic Size Indicator and the Alert Report.
The Protocol Traffic Size Indicator (labelled as Protocol Details in the IP Attack Map PDF Report) is also mentioned in the IP Attack Map application. This can be understood with the screenshot below. The IP Attack Map PDF Report is on the left and the IP Attack Map application GUI is in the right.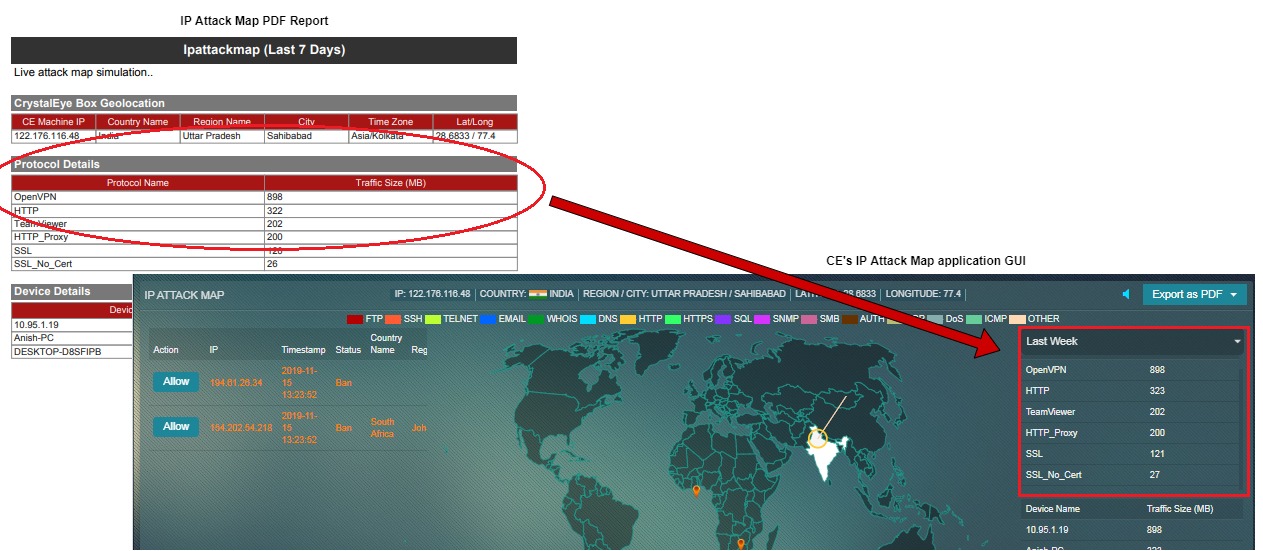
The Device Traffic Size Indicator (labelled as Device Details in the IP Attack Map PDF Report) is also mentioned in the IP Attack Map application. This can be understood with the screenshot below. The IP Attack Map PDF Report is on the left and the IP Attack Map application GUI is on the right.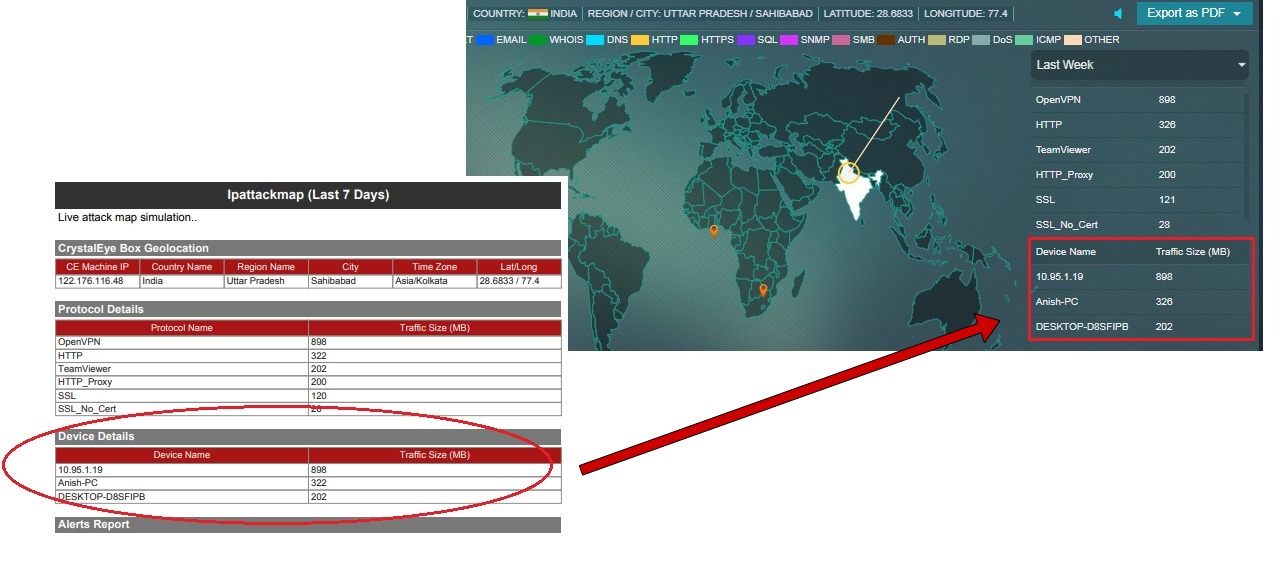
The Alerts in the PDF Report is also mentioned in the IP Attack Map application. This can be understood with the screenshot below. The IP Attack Map PDF Report is below and the IP Attack Map application GUI is on the top.