IDS/IPS Alerts
The IDS/IPS Alerts application is an events/alerts management tool that enables CE administrators to classify and analyse alerts generated by the Crystal Eye appliance. The application provides a pool of data relating to Alerts, Escalated Alerts, Events, AV Alerts, and Escalated AV Alerts that can further be utilized for analysing Crystal Eye traffic. The data shared under these categories can be filtered as required. A list of reports relating to Alerts, Flow, DNS, and SSH can also be viewed and can be sent to a designated email address.
Note: The alerts that are generated in the IDS/IPS Alerts application can also be viewed in the IDS/IPS Alerts Report section of the IP Attack Map in the Security Dashboard. Apart from this, these alerts can also be viewed in the IDS/IPS Alerts Report section of IP Attack Map application.
The IDS/IPS Alerts application is installed by default and can be accessed from the left-hand navigation panel.
Left-hand Navigation Panel > Reports > IDS/IPS Alerts application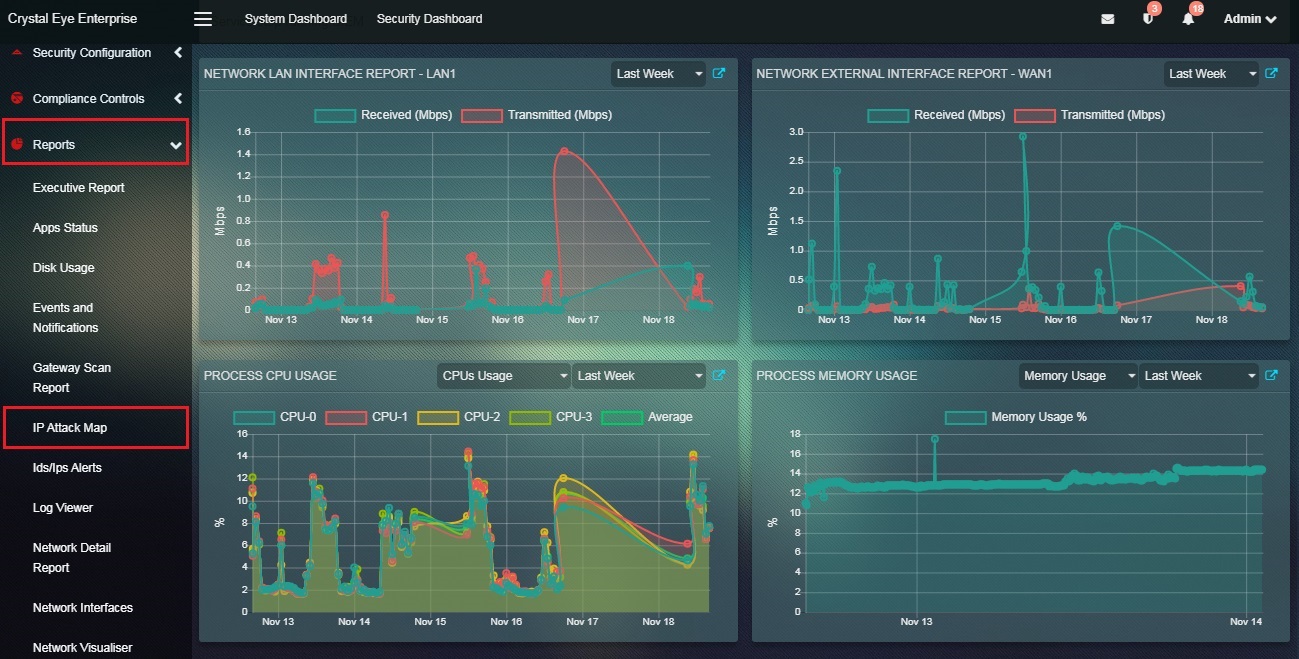 |
|---|
The IDS/IPS Inbox Report shows all the IDS/IPS alerts generated by the Crystal Eye device. The list of information displayed on this report is identical to the data shared in the IDS/IPS Alerts Report section of the IP Attack Map in the Security Dashboard. Infact, traces of this report can also be seen in IDS/IPS Alert Report section of the IP Attack Map application and the Alerts section of the IDS/IPS Alerts application. The entire set of IDS/IPS alerts are displayed in the Inbox Report while they get generated by the CE appliance on a real-time basis.
Each Alert in the Inbox Report section has the following information:
Timestamp: Refers to the date and time at which the alert was triggered. Source IP: This is the IP address from where the attack originated. Destination IP: It refers to the IP address which was taken in as the target by the attacker. Country: This is the Country from where the alert/attack originated. Description: Describes the type of the attack Rule Type: Shows the rule category that triggered the alert
Each alert in the Inbox Report section can be escalated to Red Piranha’s Security Operation’s Team. The alert is triggered by rules which generate alert analysis data such as Source IP and Destination IP. The source IP relates to the IP address from where the attack originated and the destination IP is the targeted IP address.
There are two important reports that are based on the source IP address and destination IP address mentioned on each alert displayed in the Inbox Report section. So if the source IP address of an alert is 10.95.1.253 and the destination IP address of the alert is 40.118.201.45, the CE administrator can find out how many times an alert was triggered involving the source IP 10.95.1.253. Likewise, one can also find out how many times an alert was triggered involving destination IP as 40.118.201.45
While IDS/IPS alerts are generated on a real-time basis, its timestamp is also recorded which can be used as a filter input to segregate alerts pertaining to a specific time period. Categorizing alerts according to a particular time bucket can be a requirement while analysing alerts.
How to Filter Inbox Reports According to a Specific Time Bucket?
Step 1: In the IDS/IPS Alert application page, select the time from the dropdown under IDS/IPS Alerts Report by Time section for which the Inbox Report needs to be filtered.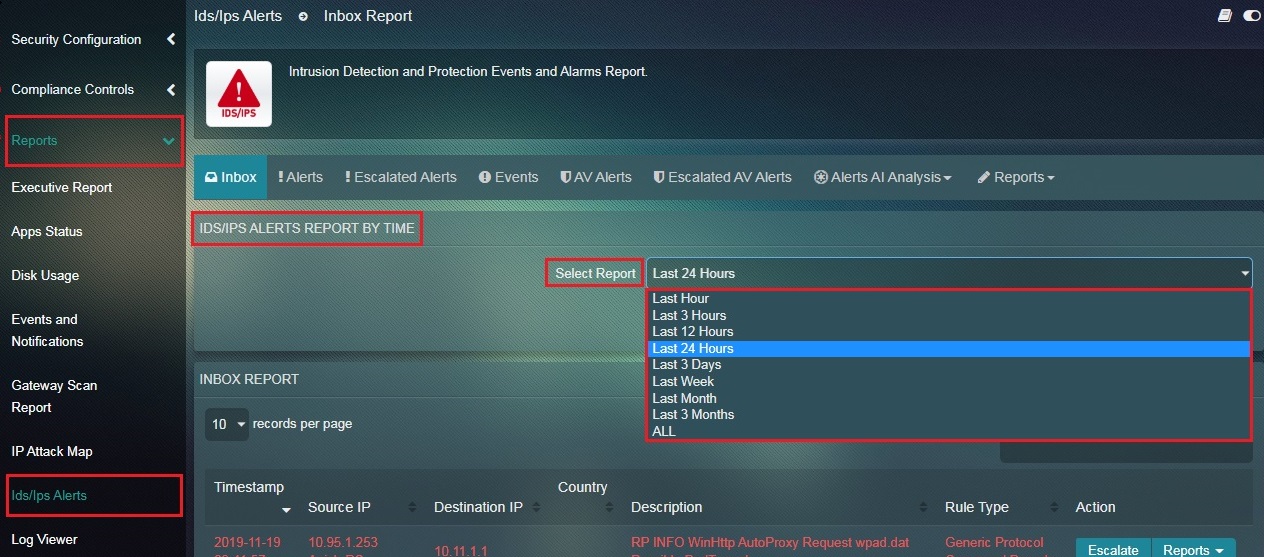
Note: Once the time has been selected the Inbox Report will dynamically change showing alerts for the selected time bucket.
The Crystal Eye administrator can opt to view in-depth information related to a particular IDS/IPS Alert. The list of information that can be attained to compliment in-depth analysis of the IDS/IPS alerts are Timestamp, Protocol, Source, Destination, Interface, Flow ID, Signature, Rule type, Signature ID, Severity, Continent Code, Country Code, Latitude, Region Name, Coordinates, Country Name, Longitude, IP Address and Region Code.
How to Gain Access to In-depth Information about a Particular IDS/IPS Alert?
Step 1: In the IDS/IPS Alert application page, click the IDS/IPS Alert which needs to be analysed.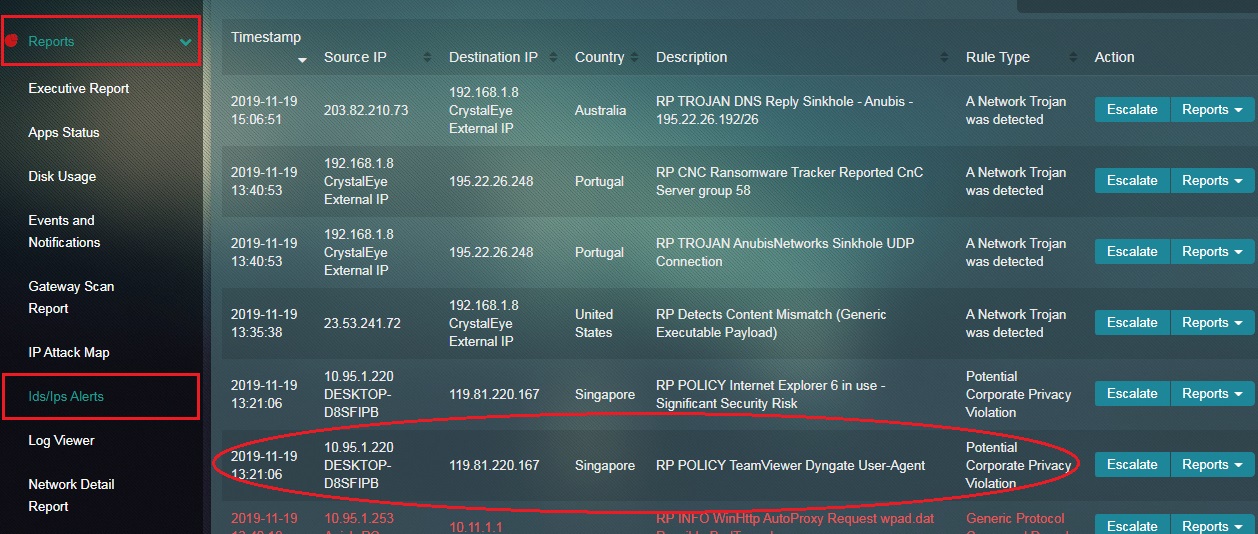
Step 2: You will now see the page containing in-depth information about the alert.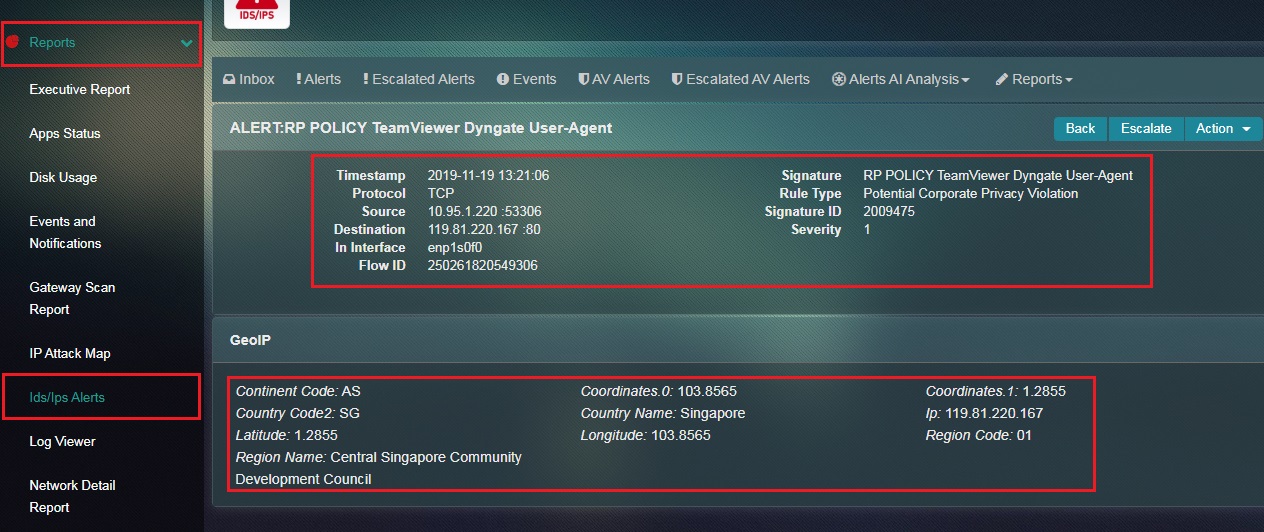
All attack alerts can be escalated to Red Piranha’s Security Operations Team after the Incident Response Services application is installed. Escalations will not be processed until the Incident Response Services application is installed and configured. The details of the alerts that are escalated are also mentioned in the Escalated Alerts section of the of the IDS/IPS Alerts application where a PDF report can also be generated for the same. Apart from Inbox Reports section of the IDS/IPS Alerts application, these alerts can also be escalated to RP’s Secops team from the IDS/IPS Alerts Report section under the IP Attack Map application and the Alerts section of the IDS/IPS Alert application. These alerts can also be escalated from the IDS/IPS Alerts Report section of the Security Dashboard.
Click here to know how to configure Incident Response Services application.
Note: If the Incident Response Services application is not installed and configured then the following error message will be displayed.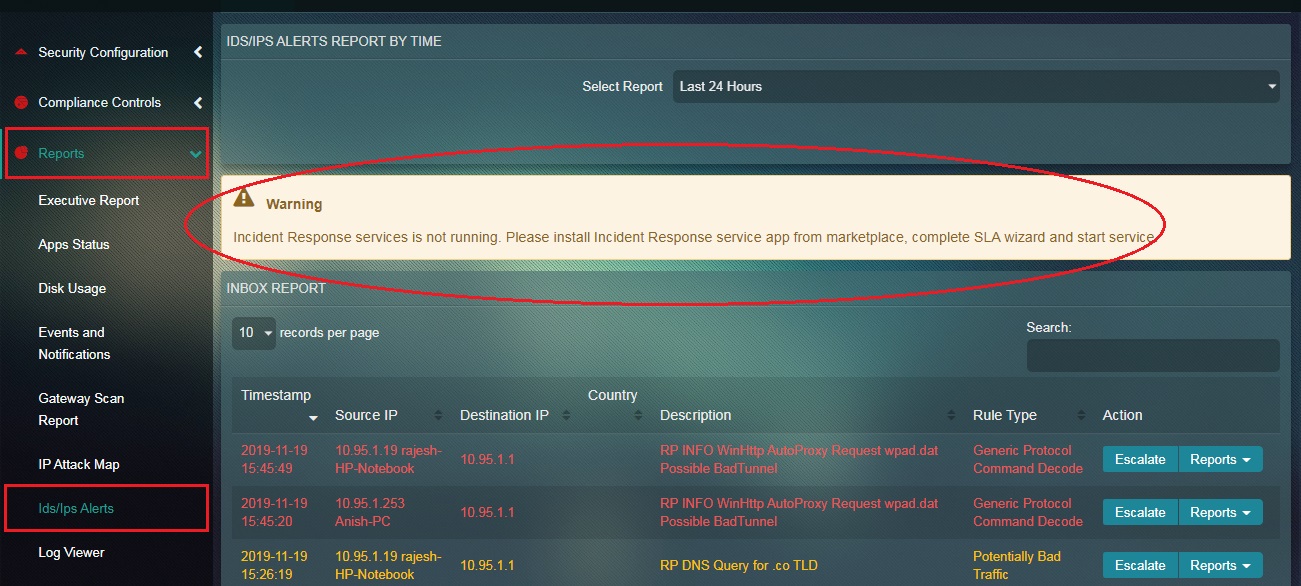
How to escalate an attack alert to Red Piranha’s security operations centre team for analysis from the Inbox Report of the IDS/IPS Alerts application?
Step 1: In the IDS/IPS Alerts application page, click the Escalate button next to the alert details.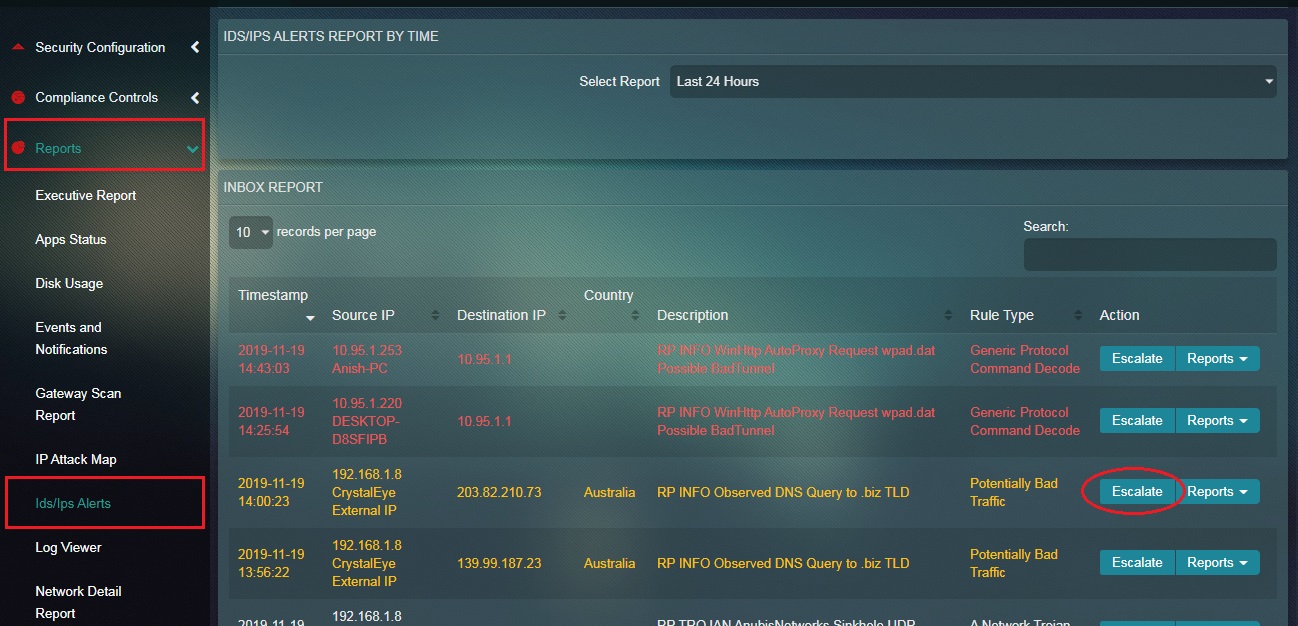
Step 2: You will now see an Add Comment pop-up. This can be used to pass on additional details to RP’s Secops Team for further analysis. Click the Submit button after adding the comment. 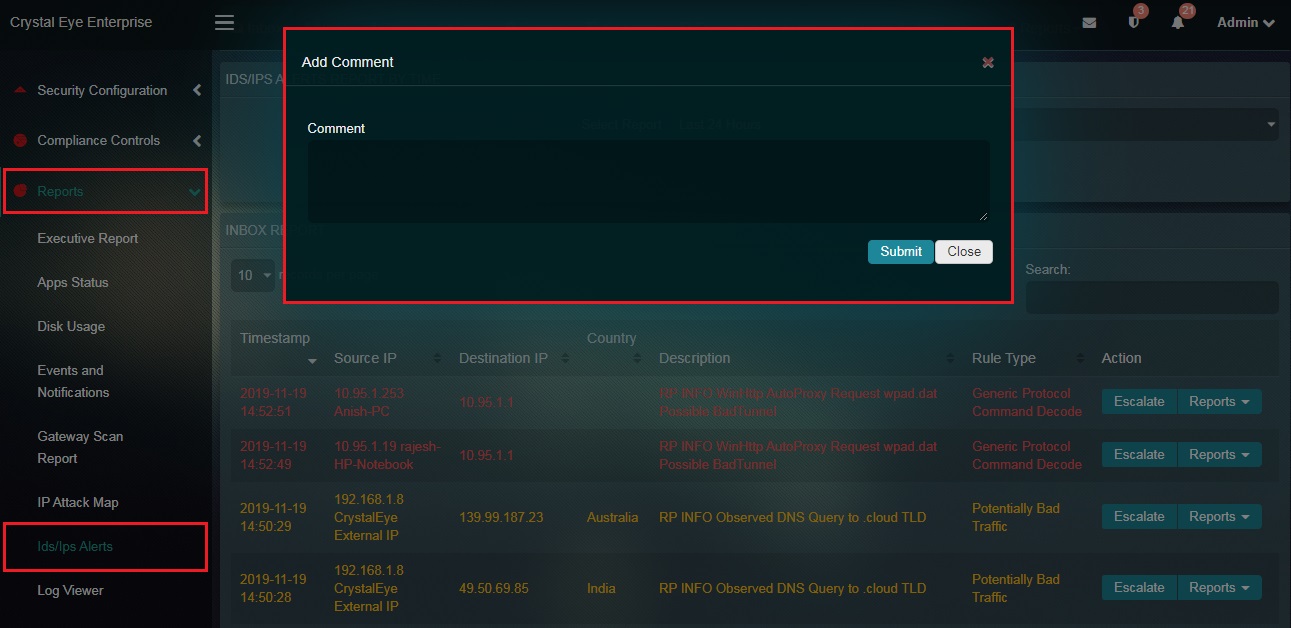
Note: IDS/IPS alerts can also be escalated from the page where we have the additional information of the alert. To get to this page click the particular IDS/IPS Alert in the IDS/IPS Alerts application page.
All the Alerts that are displayed in the Inbox Report section of the IDS/IPS Alerts application consist of a Source IP address and a Destination IP address. Crystal Eye administrators can access reports that are specific to these IPs and also know the number of alerts that were generated when these IPs were source or destination IPs in the IDS/IPS alert.
How to Fetch Reports Related to the Source IP & Destination IP of the IDS/IPS Alert?
Note: Follow the same steps mentioned below to fetch reports related to destination IP of an IDS/IPS alert.
Step 1: In the IDS/IPS Alerts application page, click the Reports dropdown button next to the IDS/IPS alerts in the Inbox Report section.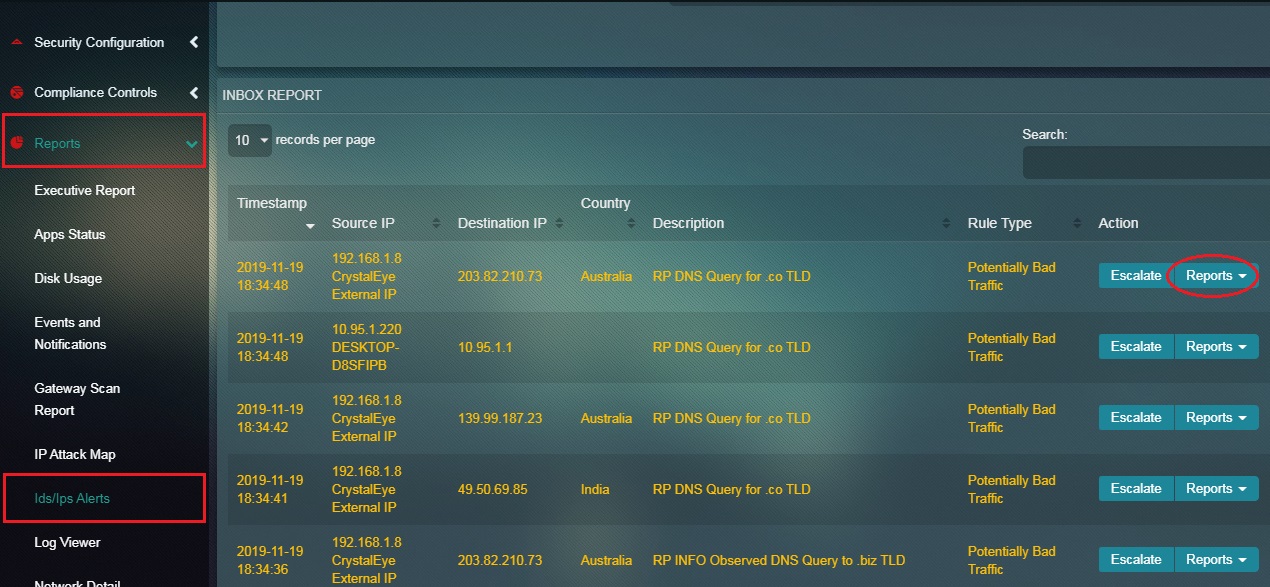
Step 2: You will now see the Source IP Report and Destination IP Report option in the Reports Dropdown.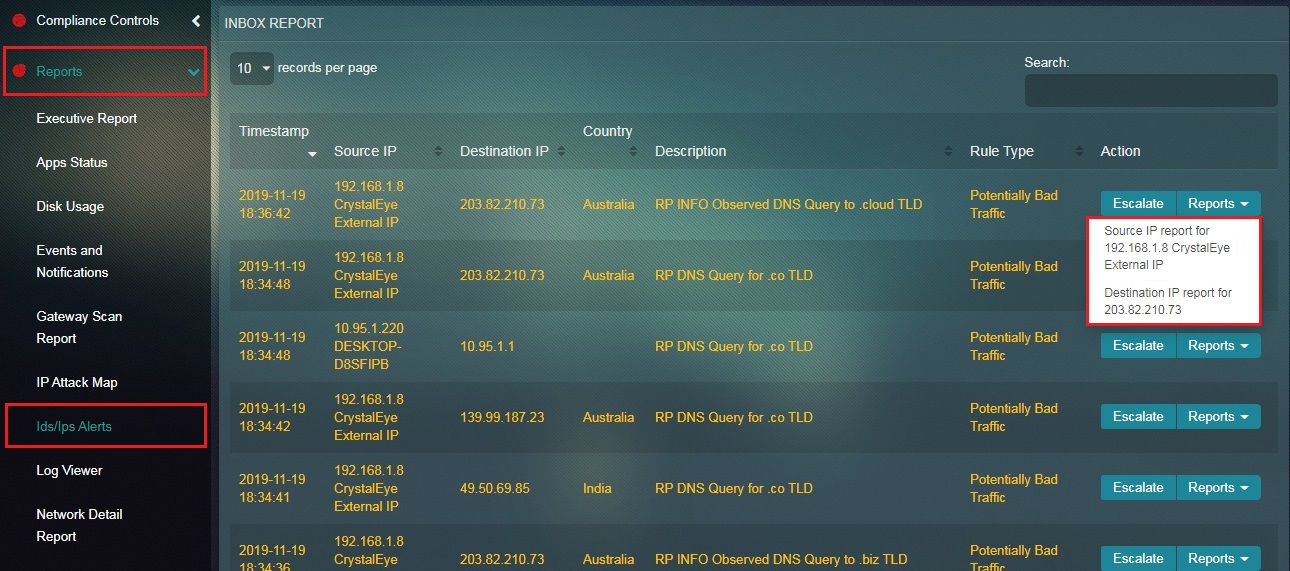
Step 3: Click the Source IP address in the Reports dropdown. 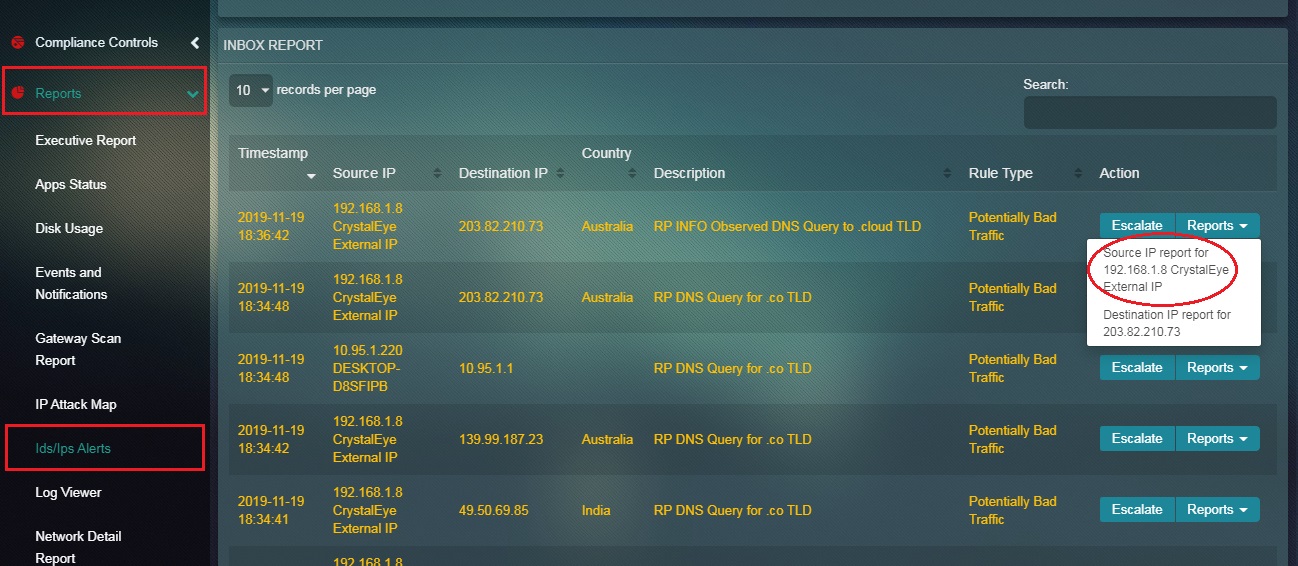
Note: Similarly, we can also select Destination IP Report from the Reports dropdown.
Step 4: You will now be directed to the Source IP address Report page.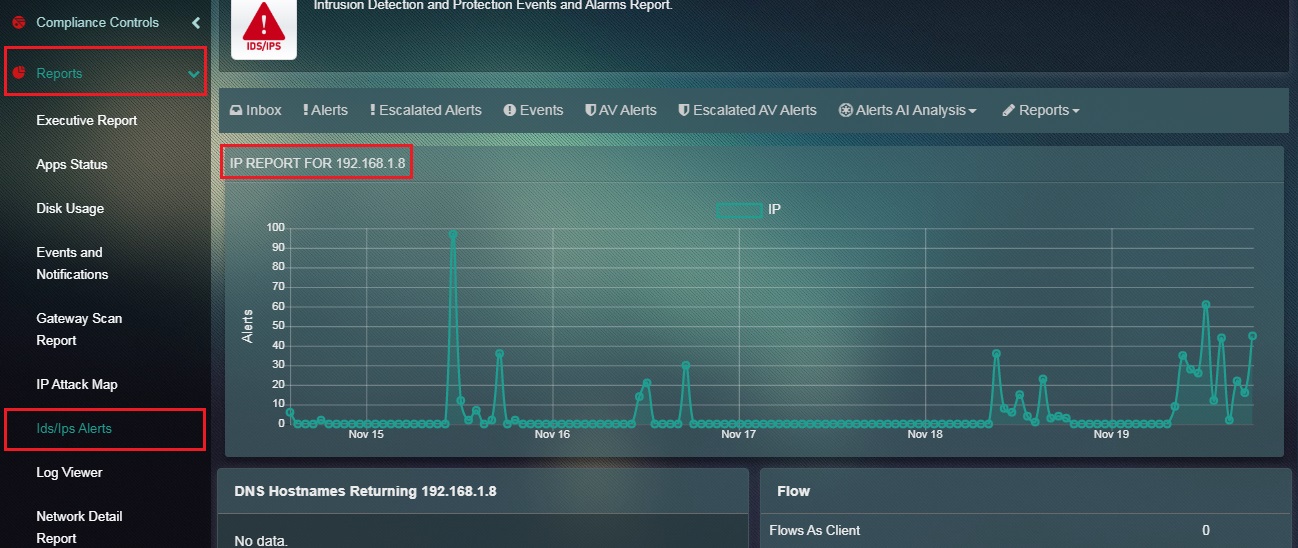
Note: On hovering the cursor over the graph points in the screenshot below, you will observe that the number of times IP address 192.168.1.8 was the source IP address in the IDS/IPS alerts. According to the data shown below, 192.168.1.8 appeared in 97 alerts as source IP address on November 15, 2019 at 11:11 AM.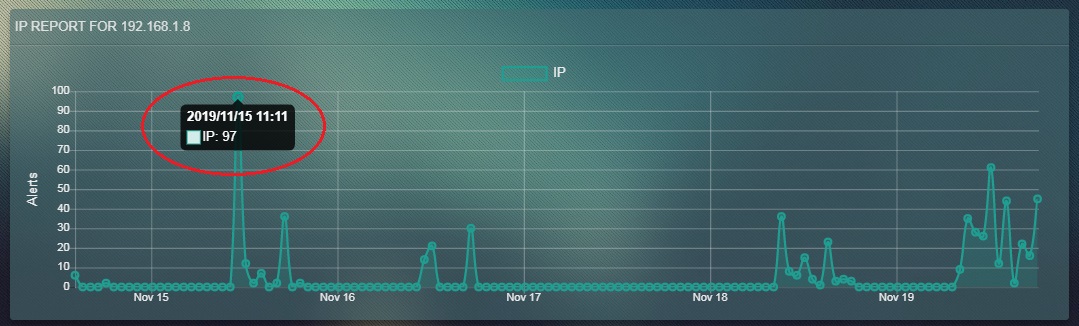
There might be instances when the Crystal Eye administrator would want to check the list of IDS/IPS alerts that were escalated to Red Piranha’s Security Operations Team for further analysis. The Escalated Alerts Report makes it convenient for CE administrators to keep a track of the escalated IDS/IPS alerts. This report can also be referred to while discussing escalated alerts with the secops team member.
Note: Red Piranha’s Security Operations Team member contacts the CE owner as soon as an IDS/IPS alert has been escalated.
How to View the Escalated Alerts Report?
Step 1: In the IDS/IPS Alerts application page, click the Escalated Alerts tab.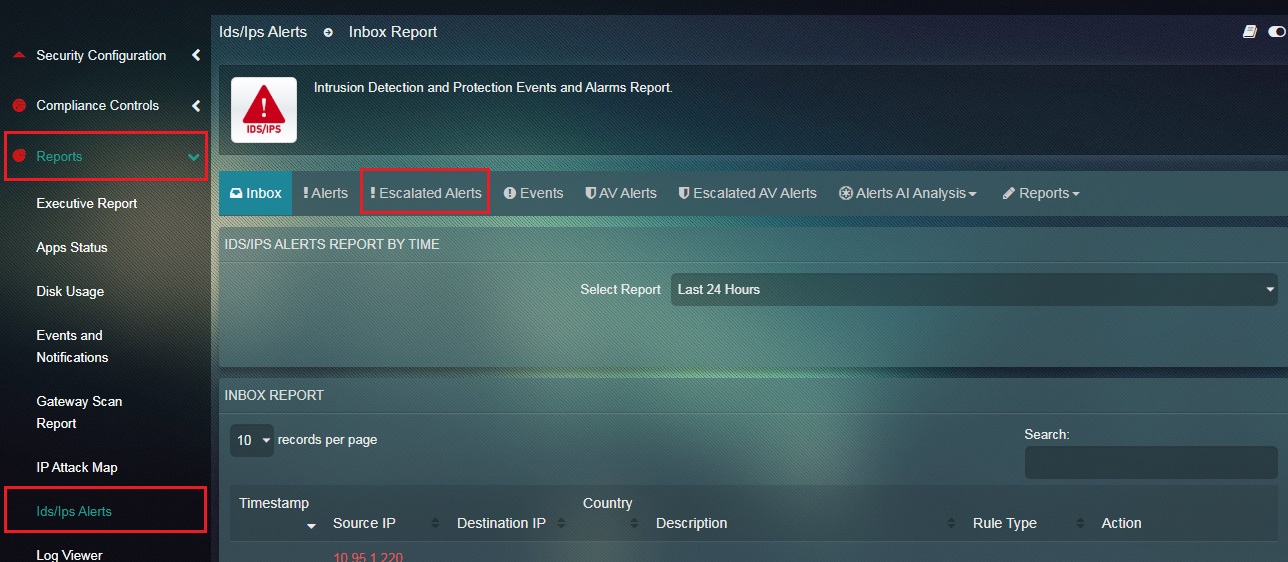
Step 2: You will now see the Escalated Alerts page with details such as Timestamp, Source IP, Destination IP, Country, Alert Description, Rule Type. 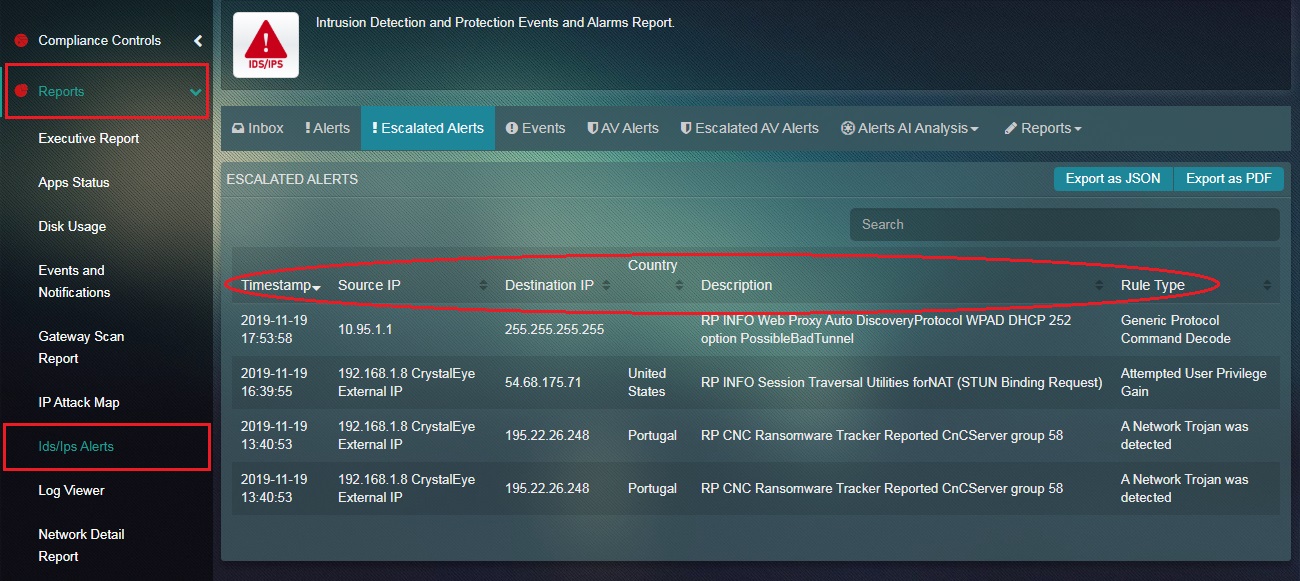
How to Export the Escalated Alerts Report as PDF or JASON Format?
Step 1: In the Escalated Alerts page, click the Export as Jason and Export as PDF button.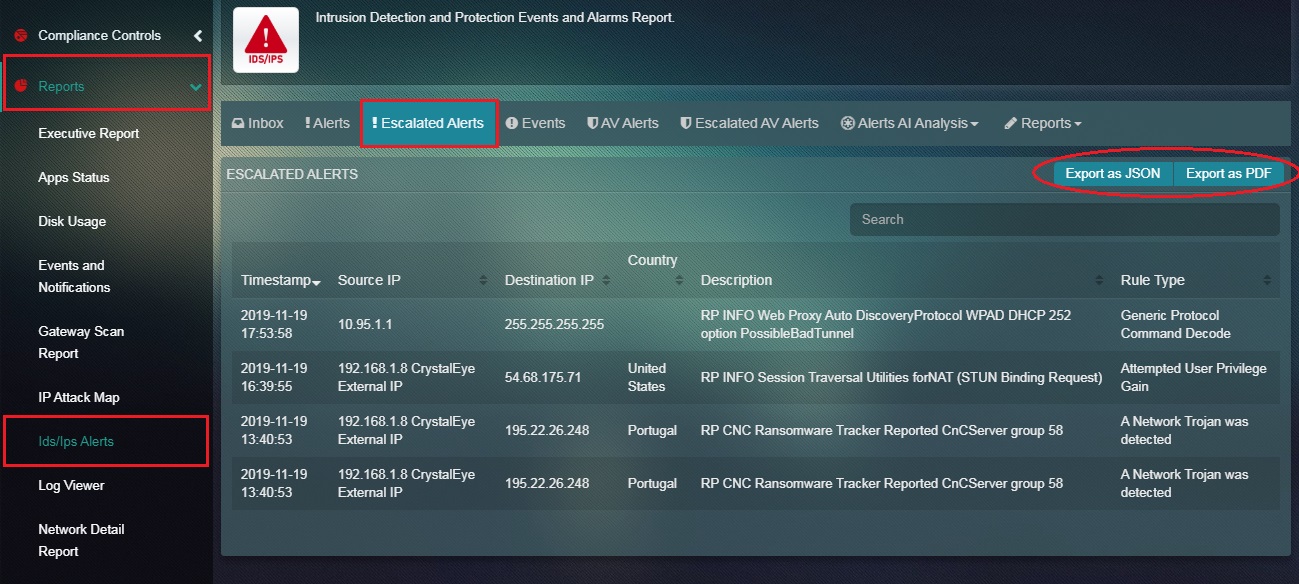
Note: The PDF format of the Escalated IDS/IPS Alerts Report sheds light on four major components of the alerts such as the Timestamp, Source IP, Destination IP and the Description (of the alert). Refer the following screenshot of the PDF format of the Escalated IDS/IPS Alerts Report.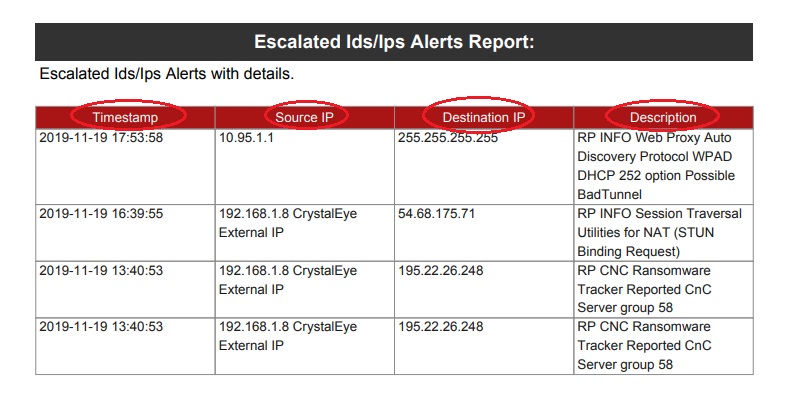
One of the most important aspects of accessing and analysing IDS/IPS Alerts are observing relevant events that might have triggered the alert. These events are displayed in the Events Report and can be viewed and filtered as per selected time bucket.
The event details consists of a list event related information such as Timestamp, Source IP, Destination IP, Country, Description, and the Event Type.
Note: The Crystal Eye appliance is designed to generated 13 Event Types namely, Alert, HTTP, Flow, Netflow, DNS, TLS, Drop, FileInfo, SSH, SMB, Kerberos, and NFS.
How to View the Events Report?
Step 1: In the IDS/IPS Alert application, click the Events tab.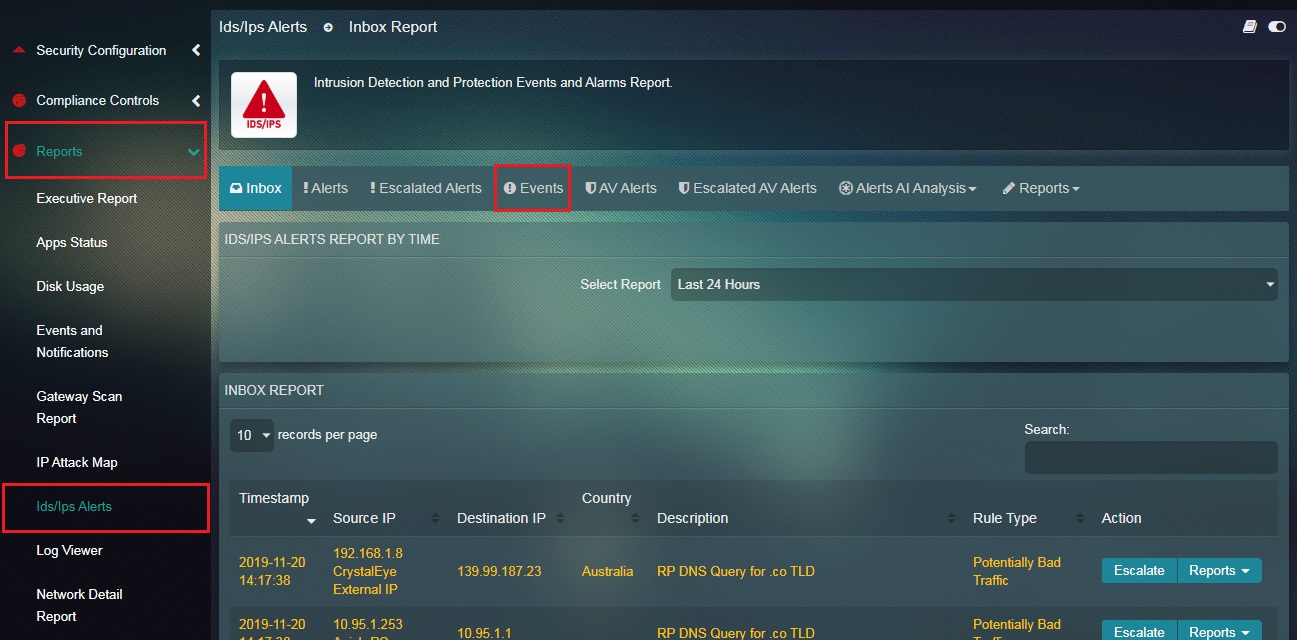
Step 2: You will now see the Events page. 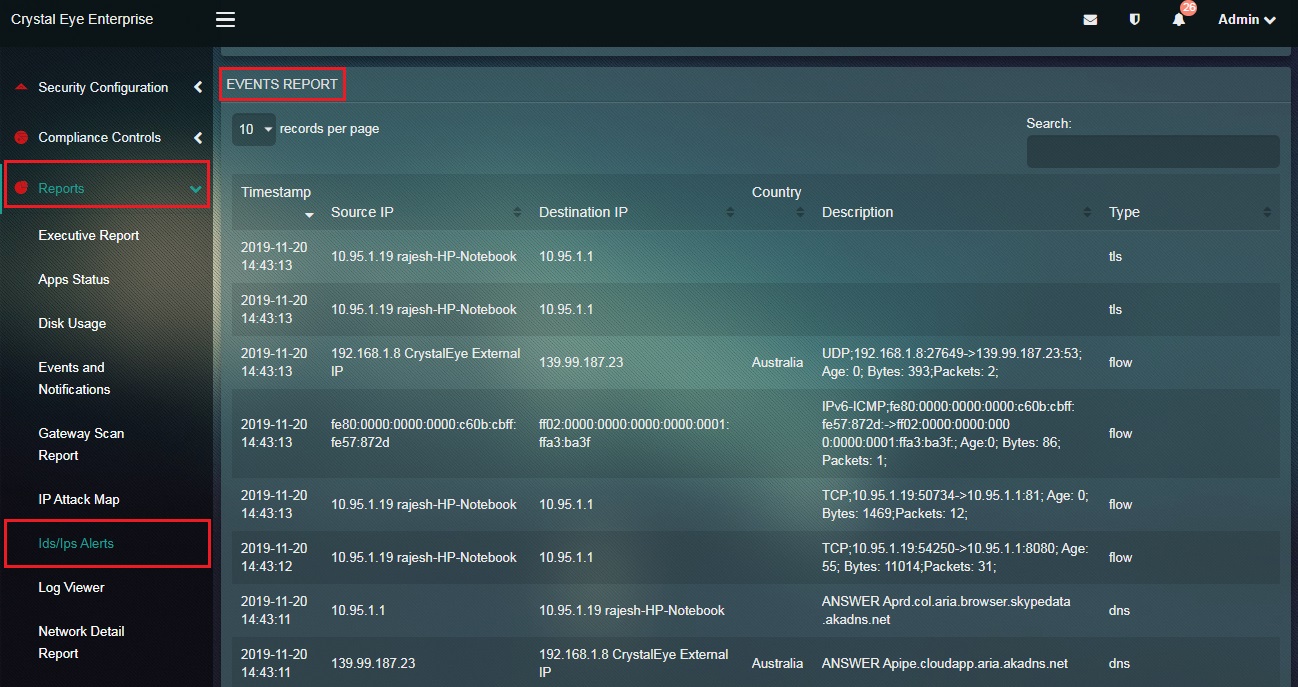
How to Filter Events Based on a Particular Event Type?
The Crystal Eye appliance is designed to generated 13 Event Types namely, Alert, HTTP, Flow, Netflow, DNS, TLS, Drop, FileInfo, SSH, SMB, Kerberos, and NFS.
Step 1: In the Events page, click the Select Event Type dropdown. 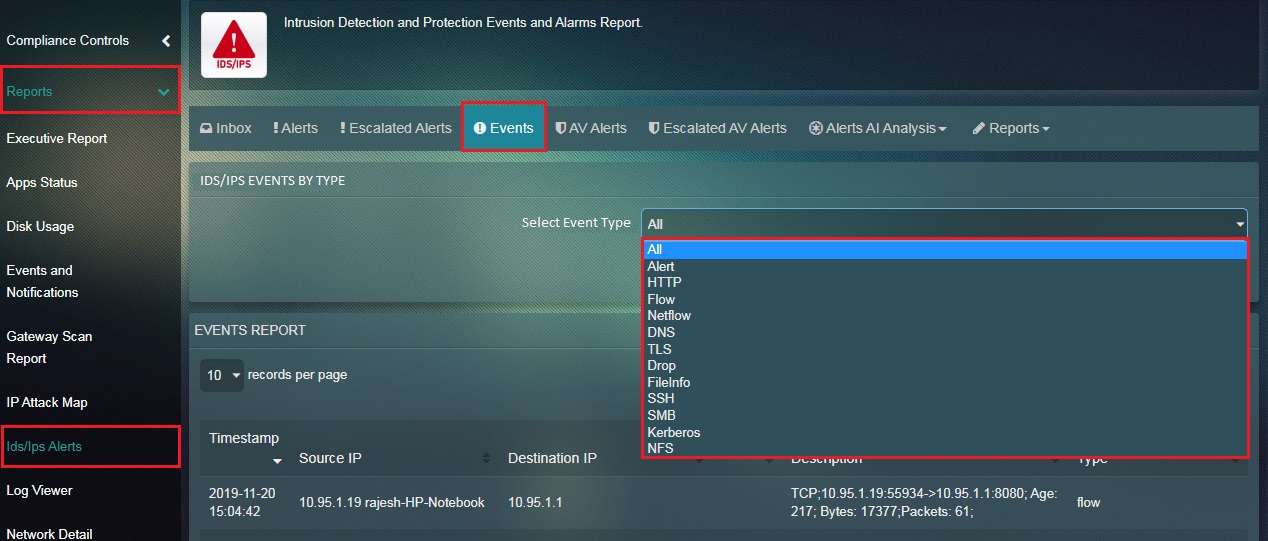
Step 2: You will now see the filtered Events Report according to the selected event type in Step 1. 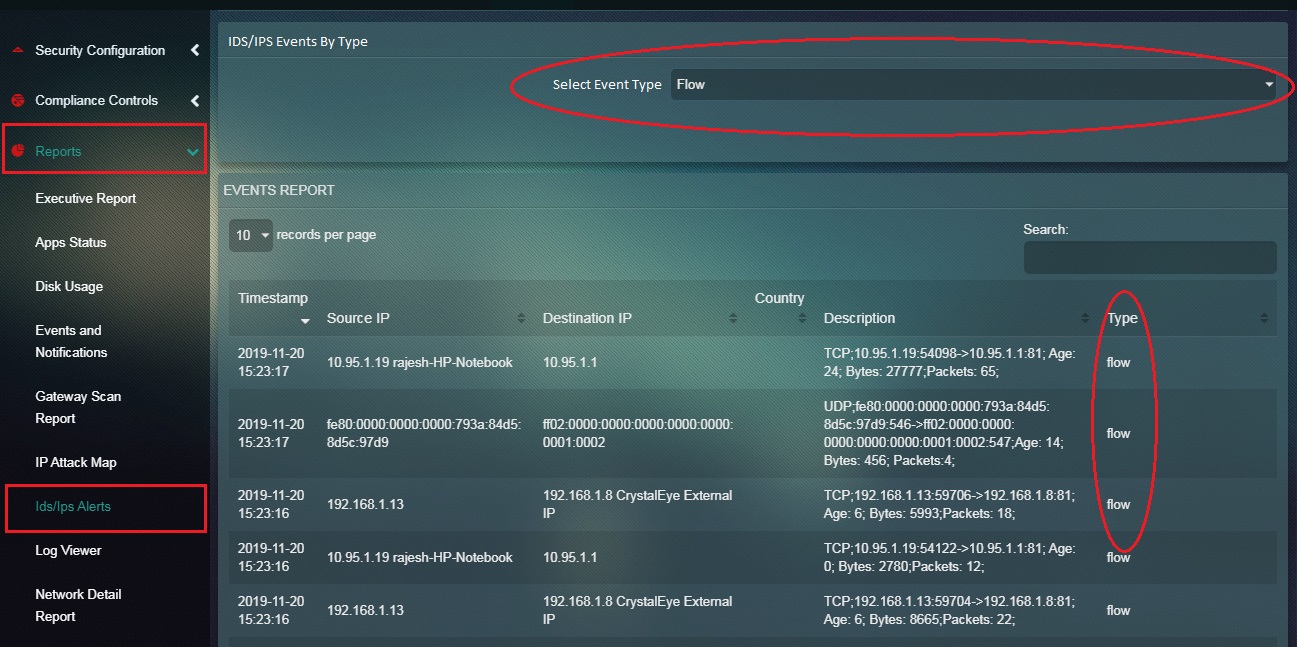
Note: In the above screenshot the Event Type selected in the dropdown is Flow and all the events in the Events Report are ‘Flow’ event type.
The Crystal Eye appliance has an inbuilt Gateway Antivirus that examines and evaluates files as they transit in real time. Crystal Eye makes use of a combination of signature and heuristic analysis to classify files to detect and automatically block malicious files in order to prevent infection from occurring. The AV Alerts Summary Report displays the AV scan summary specifying details regarding the files that were blocked. These details include Timestamp, IP Address (where the malicious files were detected), Site (domain name from where the malicious files originated), Blocked URL (URL of the blocked file), Reason (why the file was blocked), Content Type and Description.
Note: The Gateway Scan Summary can also be viewed in the Scan Summary section of the Security Dashboard application and the Scan Summary section of the Gateway Scan Reports application. You can also download a PDF Scan Summary Report from the Gateway Scan Report application.
Crystal Eye administrators can also filter the scan report for a particular time bucket. All the flagged bad content in the Gateway Scan Summary are searchable through the search bar. The files that are blocked can also be allowed to get past Crystal Eye’s AV and can also be escalated to Red Piranha’s Security Operations Team (RP Secops) for further analysis. The escalation process can only be done if the Incident Response Services application is installed and configured.
How to Filter Scan AV Report as per Time Range?
The entire AV Alerts Summary can be filtered using the time range dropdown. This feature can be used to analyse all the flagged bad content according to a particular time bucket.
Step 1: In the IDS/IPS Alerts application, click the AV Alerts tab.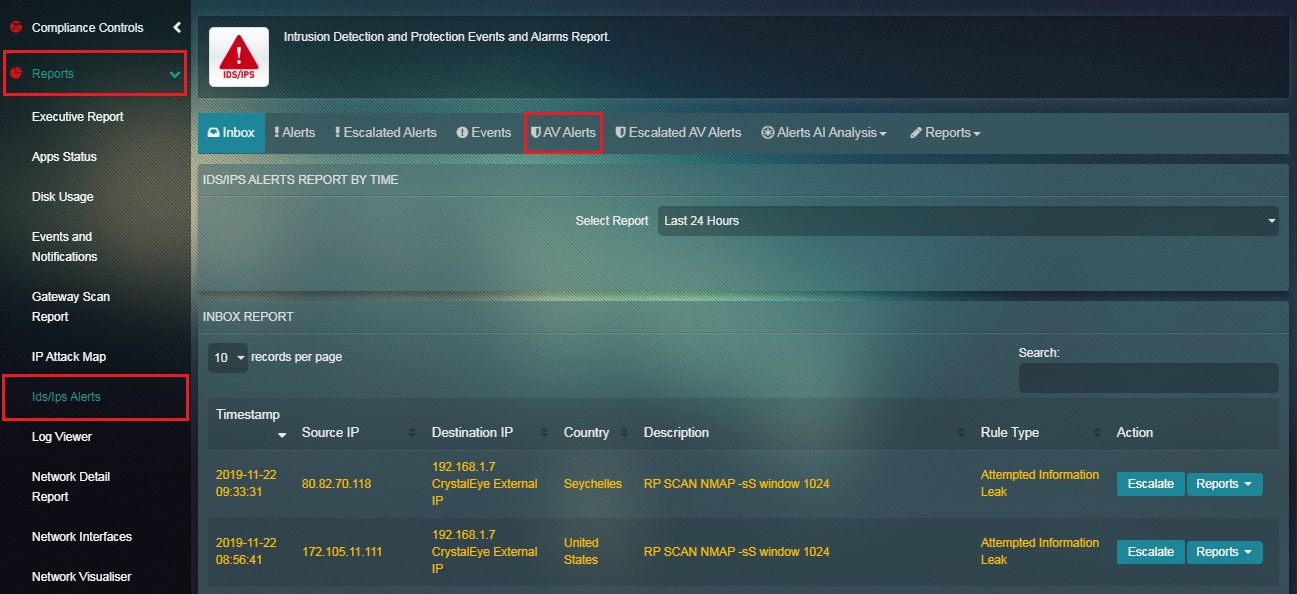
Step 2: You will now see the AV Reports page. Select the time range from the dropdown.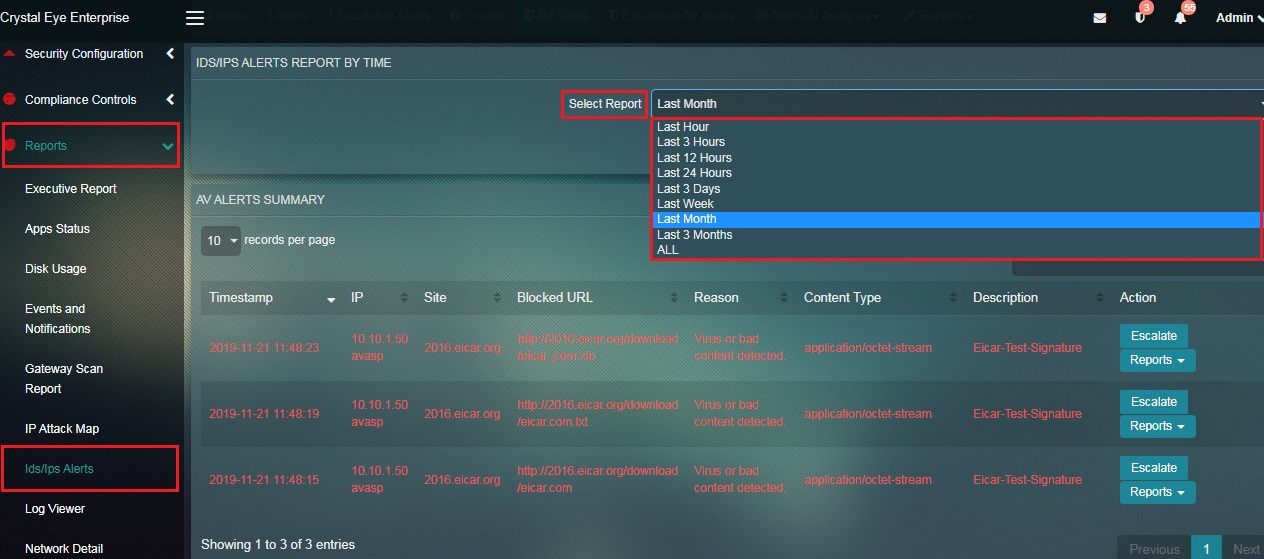
How to Allow a Flagged Bad Content from the AV Alerts section of the IDS/IPS Alerts application?
The Crystal Eye administrator can allow a flagged bad content blocked by CE’s antivirus. After the blocked files are allowed to get past Crystal Eye’s AV, the site domain name from where the files originated gets included to the Exception Sites section of Content Filter application. However, the inclusion of the website would remain limited to the exception sites section of the content filter policy assigned to the IP address where the bad content was detected at the first place.
Step 1: In the AV Alerts page, click the AV Alert or the flagged bad content. 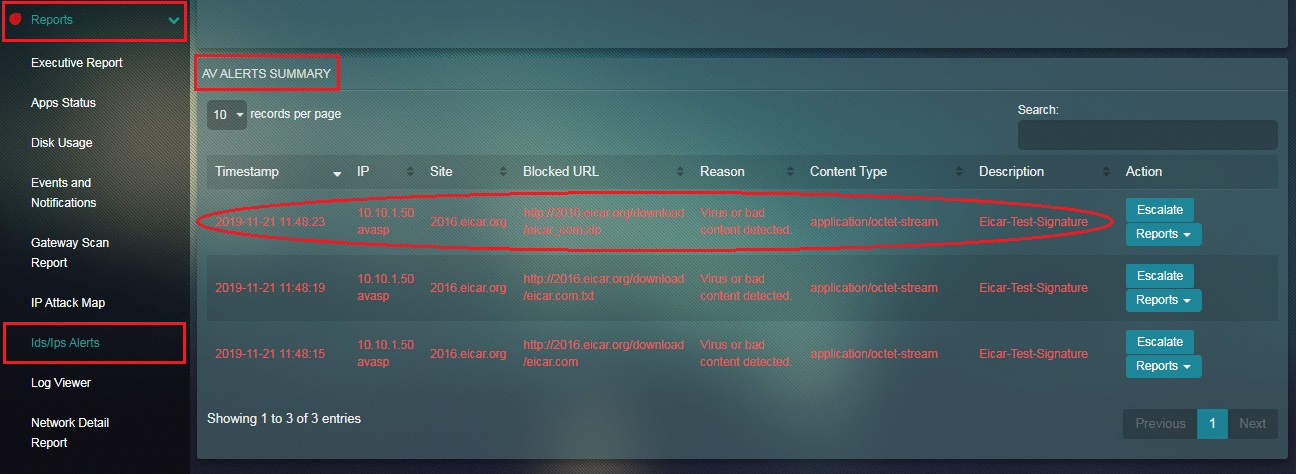
Step 2: You will now see the details of the AV alert on a dedicated page with Back, Allow and Escalate button on the top right corner. Click the Allow button.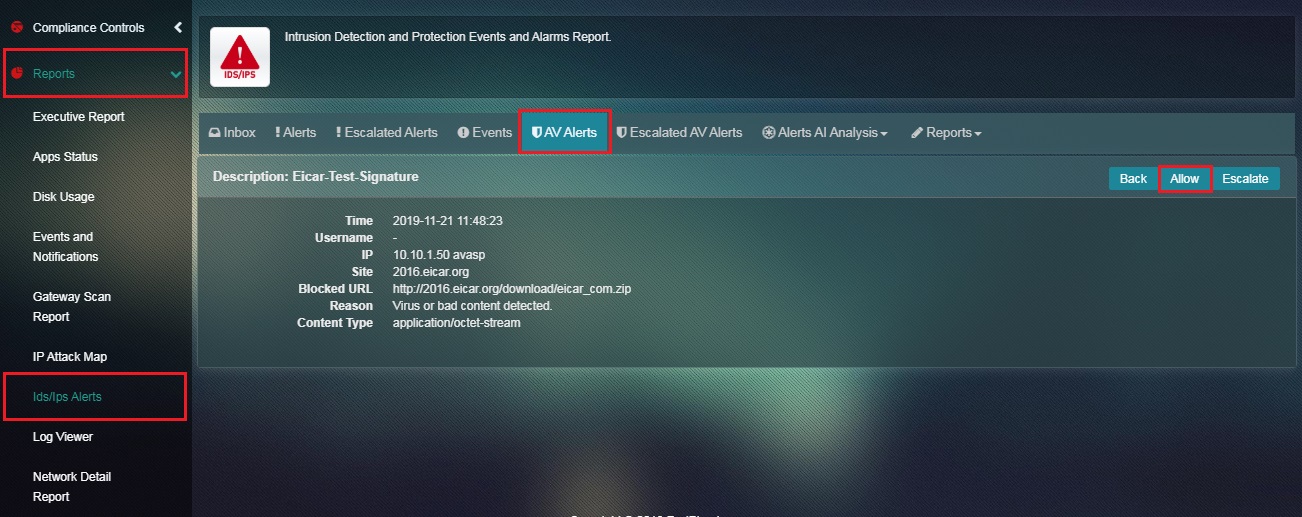
Step 3: You will now see the message, “Successfully Allowed Site”. As mentioned in the screenshot below. 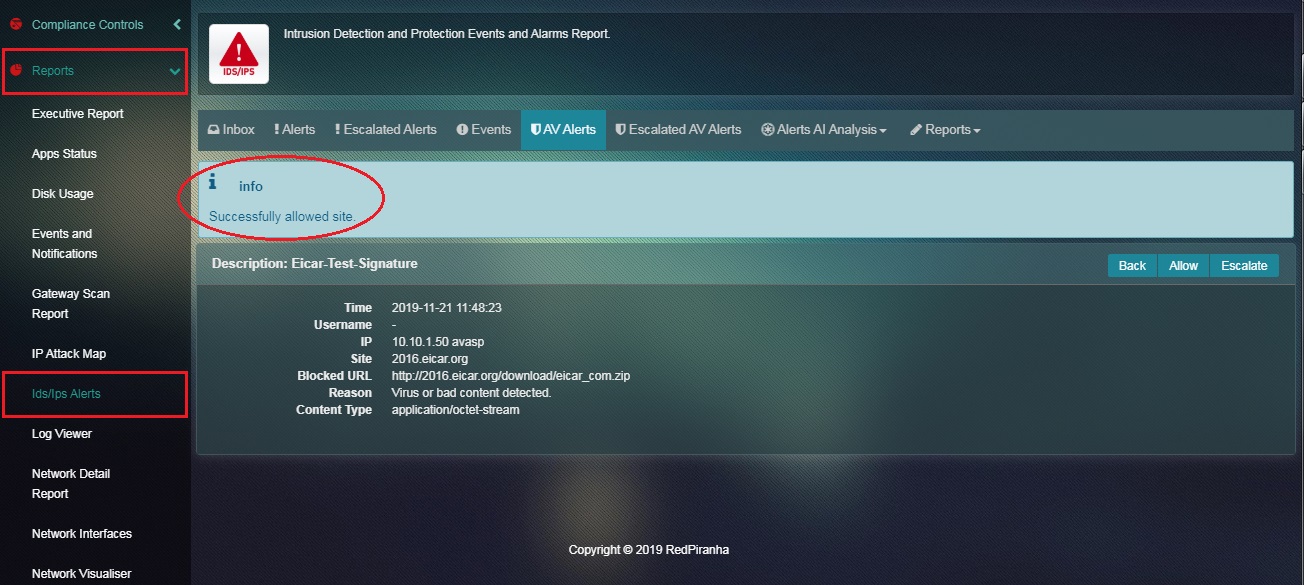
Note: Once the flagged bad content is allowed the website from where the file was downloaded gets included in the Exception Sites section of the Content Filter application. However, the inclusion of the website would remain limited to the exception sites section of the content filter policy assigned to the IP address where the bad content was detected at the first place.
How to Escalate the ‘Flagged Bad Content’ Displayed in the AV Alerts Summary section of the IDS/IPS Alerts application to RP’s Secops Team?
Before escalating the ‘flagged bad content’ to RP’s Secops Team it must be ensured that the Incident Response Services application is installed from the marketplace and configured as well. Apart from the IDS/IPS Alerts application, a ‘flagged bad content’ can also be escalated from the Scan Summary section of the Gateway Scan Report application and the Gateway Scan Summary section of the Security Dashboard.
Step 1: In the AV Alerts page, click the Escalate button next to the AV Alert in the AV Alerts Summary section. 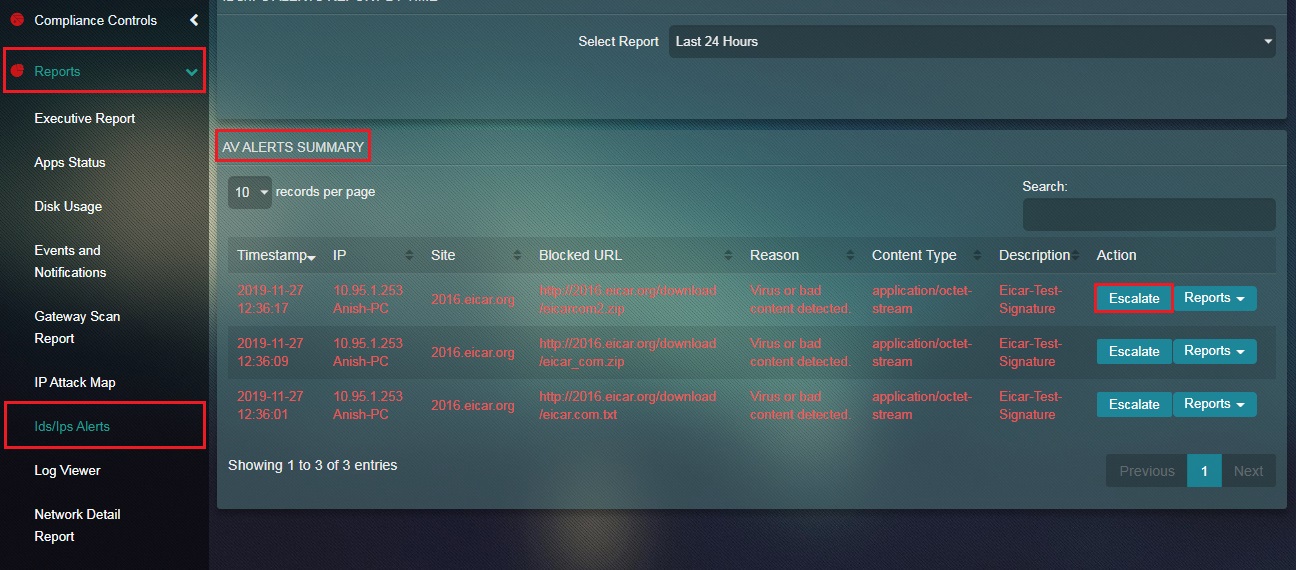
Step 2: You will now see a Comments pop-up. Enter the comment and click the Submit button. 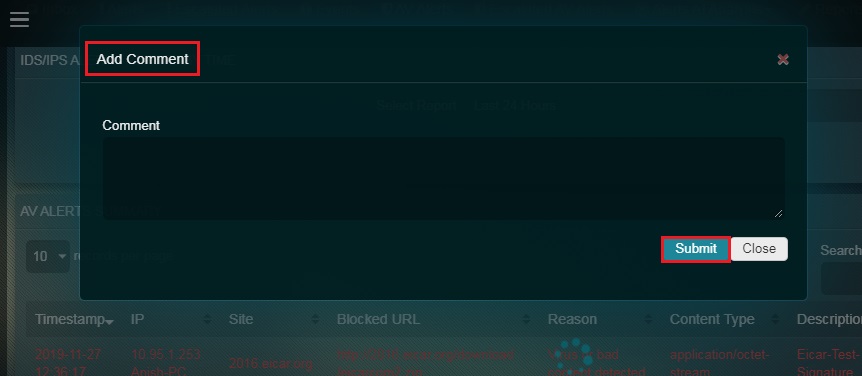
Step 3: You will now see the message, “Alert Escalated Successfully”.
The Escalated AV Alerts section shows the list of AV alerts that have been escalated to Red Piranha’s Security Operations Team. These AV Alerts are the ones that have been escalated from Security Dashboard, Gateway Scan Report application and IDS/IPS Alerts application.
The escalated AV alerts page consists of information pertaining to the alert detected by the Crystal Eye appliance. The details mentioned here sheds light on the IP address and device name where the virus was detected, the source site of the virus, the reason and the description of the detected virus signature.
How to Export PDF report showing the total number of AV Alerts escalated from the Crystal Eye appliance?
Step 1: In the IDS/IPS Alerts page, click the Escalated AV Alerts tab.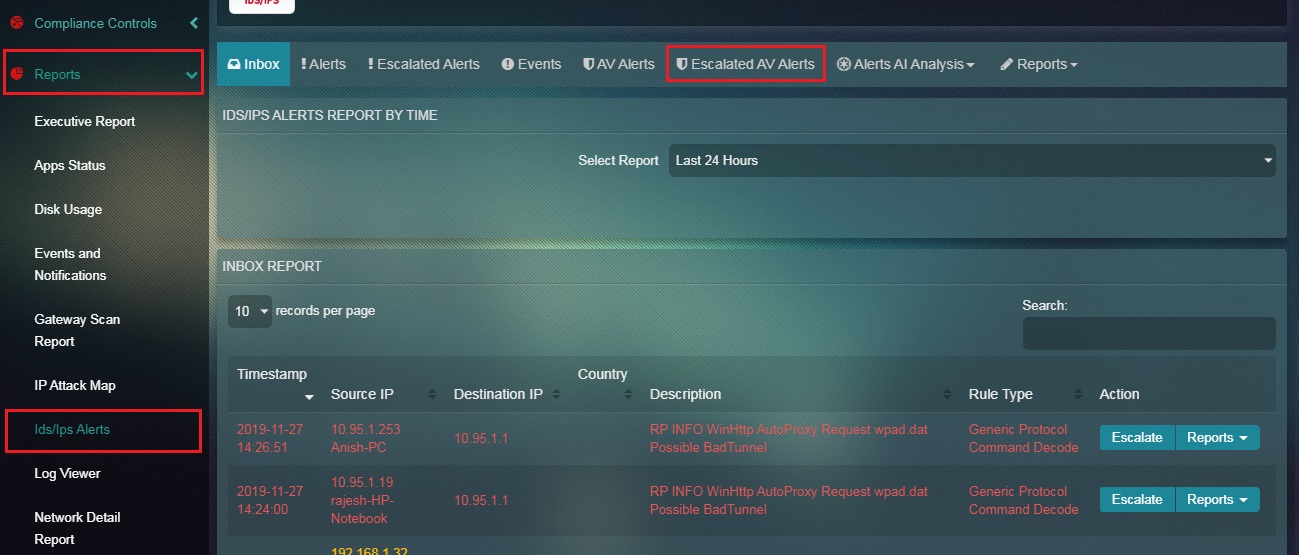
Step 2: You will now see the Escalated AV Alerts page. Click the Export as PDF button under the Escalated AV Alerts section.
The IDS/IPS Alerts application generates reports on Alerts, Flow, DNS, and SSH. The CE administrator has the option to view individual reports on Alerts, Flow, DNS, SSH and can also schedule a periodic Summary Report. The summary report has consolidated information related to alerts, flow, DNS and SSH. These reports can be emailed to the email ID of your choice from the GUI. Each report has a diagrammatic representation of the Alerts, Flow, DNS and SSH instances recorded by the Crystal Eye appliances. The data shown in the report can also be filtered according to the desired time range.
The Alerts Report provides a 360 degree view of the alerts recorded by the Crystal Eye appliance. All alerts can be filtered according to the chosen time range. The total number of alerts are recorded and displayed according to the selected time range in the Alerts Over Time graph. This report also provides vital information on the Top Alert Signature, Top Alert Category, Top Alerting Source IPs, Top Alerting Destination IPs, Top Alerting Source Ports and Top Alerting Destination Ports. The entire information can be co-related while analysing alerts generated by the Crystal Eye appliance.
How to View the Alerts Report in the IDS/IPS Alerts application?
Step 1: In the IDS/IPS Alerts application page, click the Reports dropdown button and select Alerts.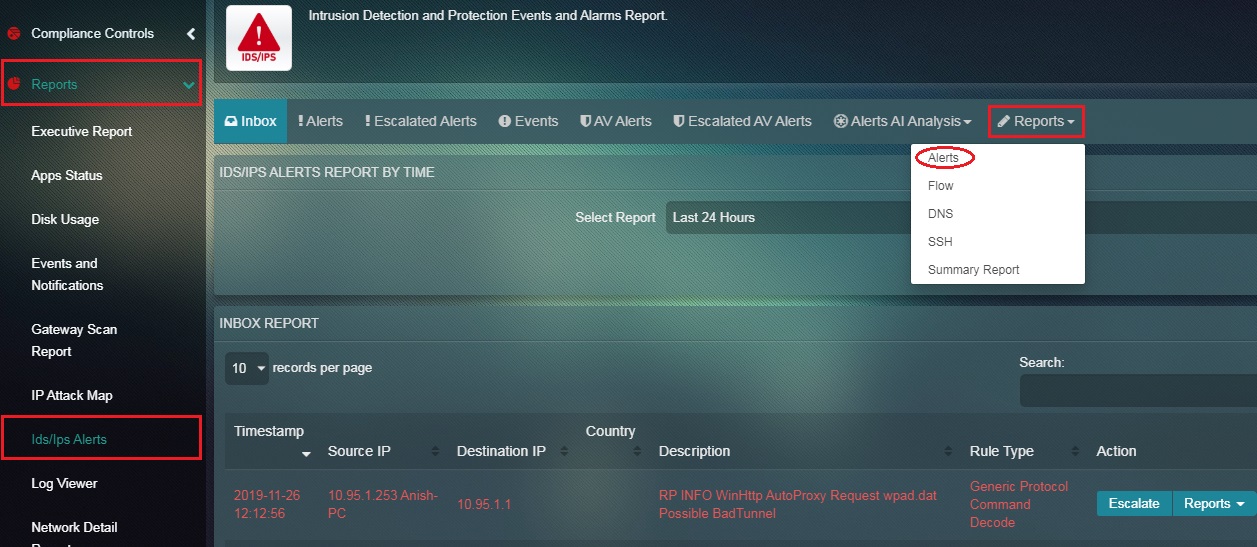
Step 2: You will now see the Alerts Report. 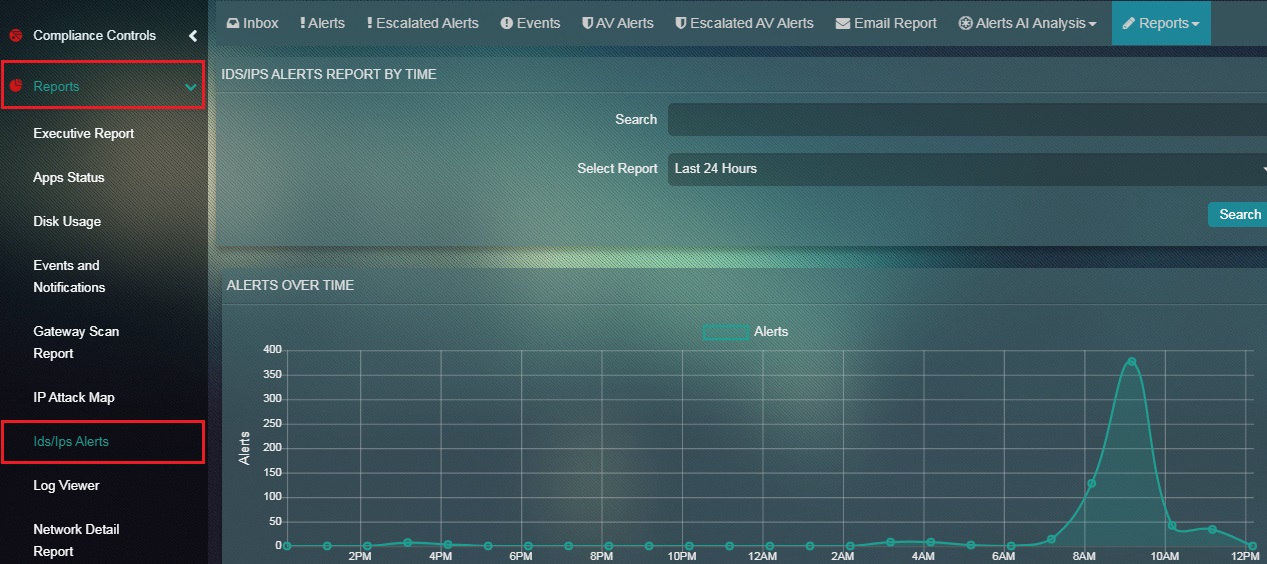
How to Filter the Alerts Report according to a Particular Time Range?
Step 1: In the Alerts Report page, select the time range from the dropdown under the IDS/IPS Alerts Report by Time section.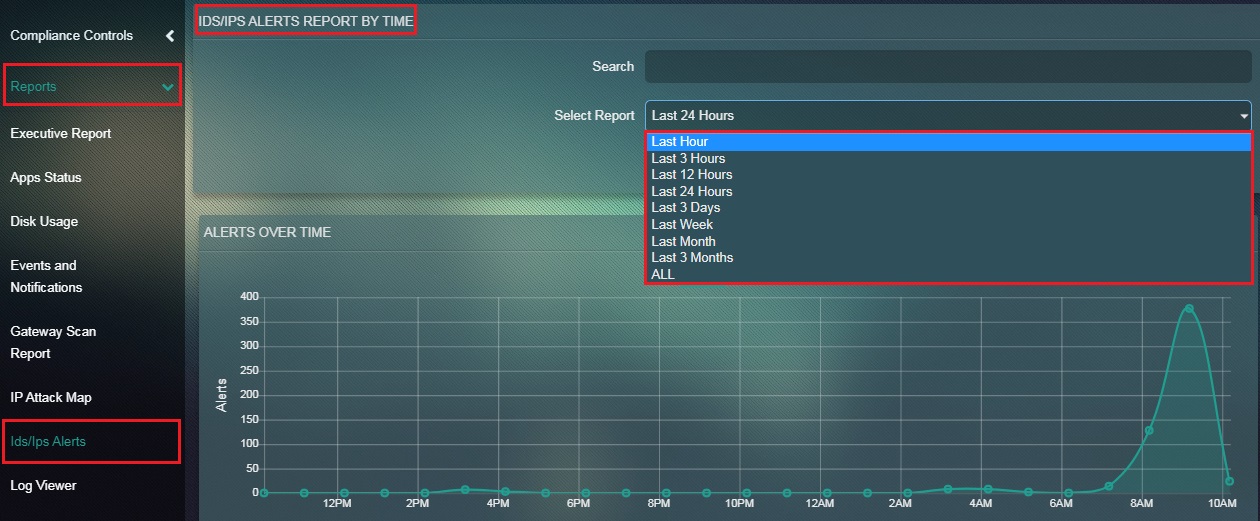
Note: The alert report will automatically get filtered once this is done.
How to Interpret the Data Mentioned in the Alerts Over Time Graph?
Step 1: In the Alerts Report page, the Alerts Over Time Graph has time in the x axis and the number of alerts in the y axis. 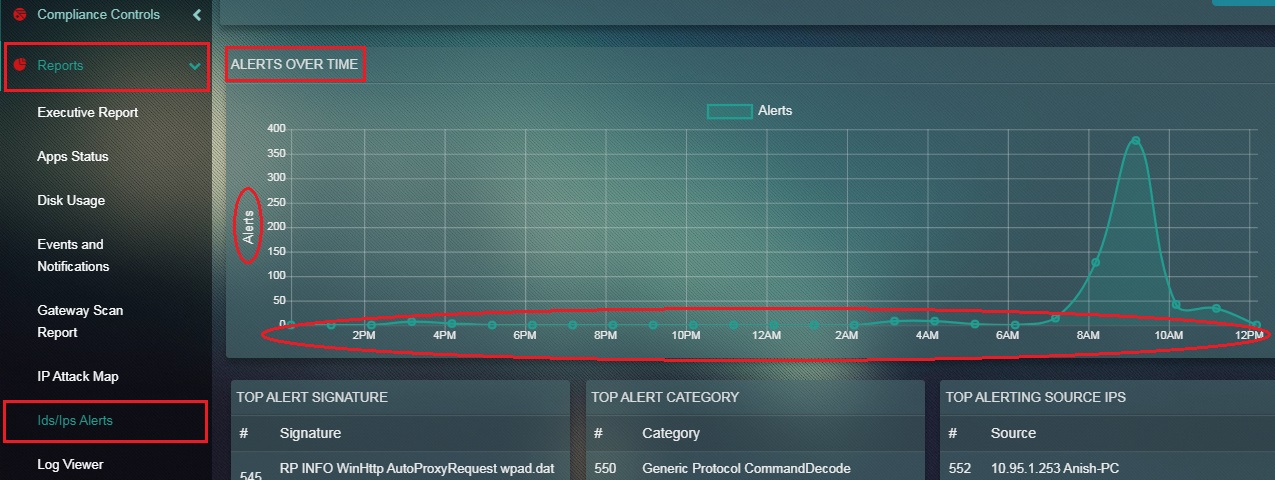
Note: The graph shows the number of alerts raised and recorded by the Crystal Eye appliance at a given point of time.
How to email the Alerts Report to any email address of your choice?
Step 1: In the IDS/IPS Alerts application page, click the Reports dropdown button and select Alerts.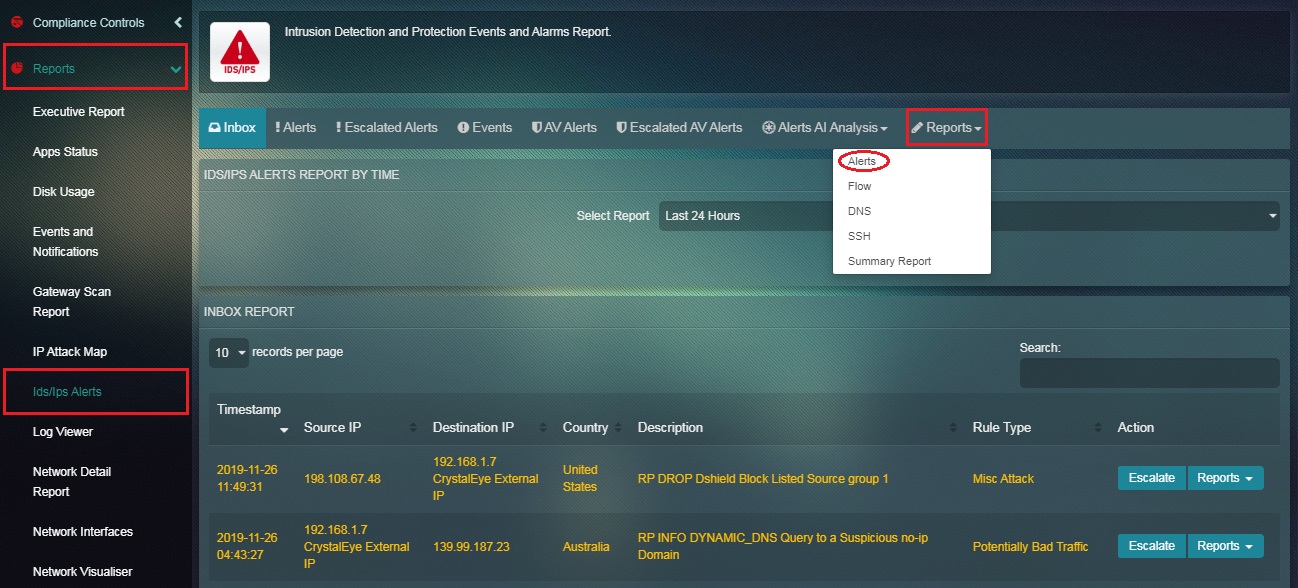
Step 2: You will now see the Alert Report page. Click the Email Report tab. 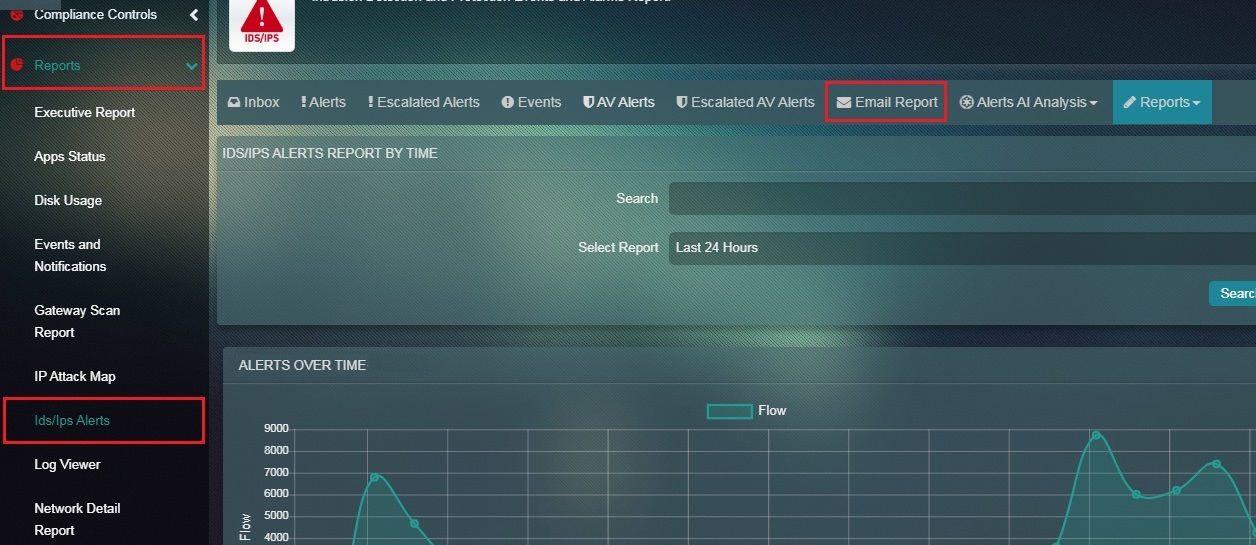
Step 3: You will now see an email pop-up. Enter the desired email in the textbox and click the Send button.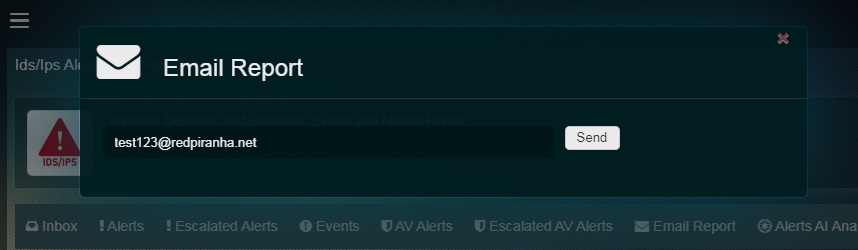
The Flow Report shows the netflow counts of the traffic as recorded by the Crystal Eye appliance. There is an option to select a time bucket in order to filter the flow report as per time. The netflow count is recorded and displayed according to the selected time range in the Netflow Events Over Time graph. This report also provides vital information on the Top Clients by Flow Count and the Top Servers by Flow Count. The information provided here can also be co-related while analysing alerts generated by the CE appliance.
How to View the Flow Report in the IDS/IPS Alerts application?
Step 1: In the IDS/IPS Alerts application page, click the Reports dropdown button and select Flow.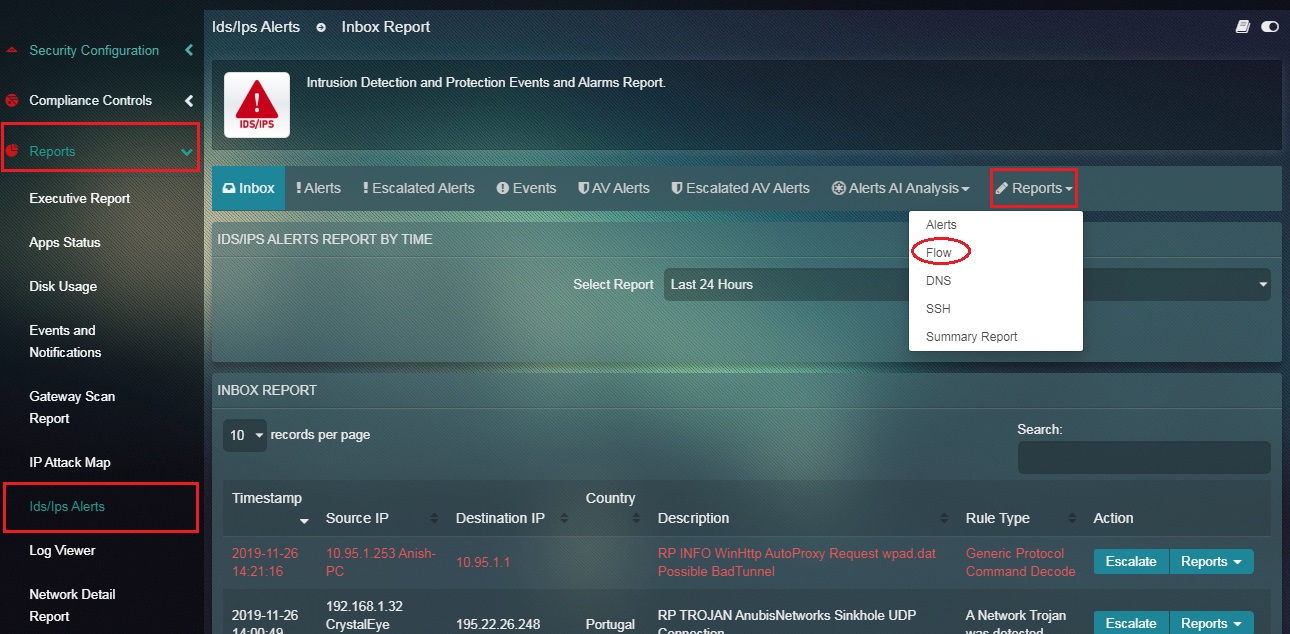
Step 2: You will now see the Flow Report page. 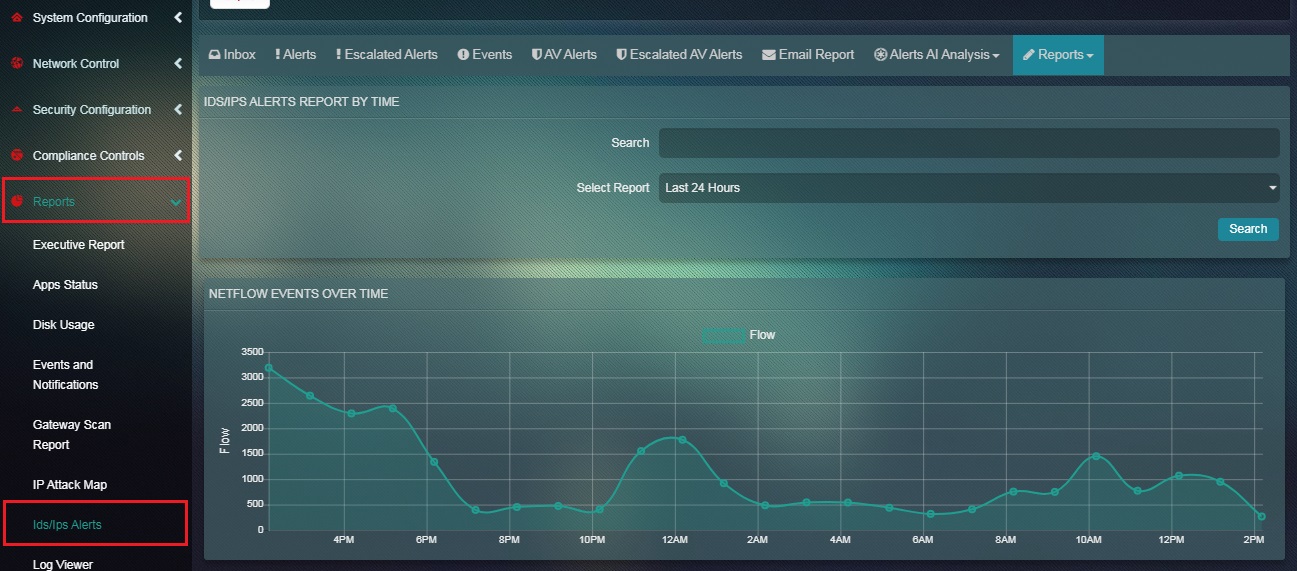
How to Filter the Flow Report according to a Particular Time Range?
Step 1: In the Flow Report page, select the time range from the dropdown under the IDS/IPS Alerts Report by Time section.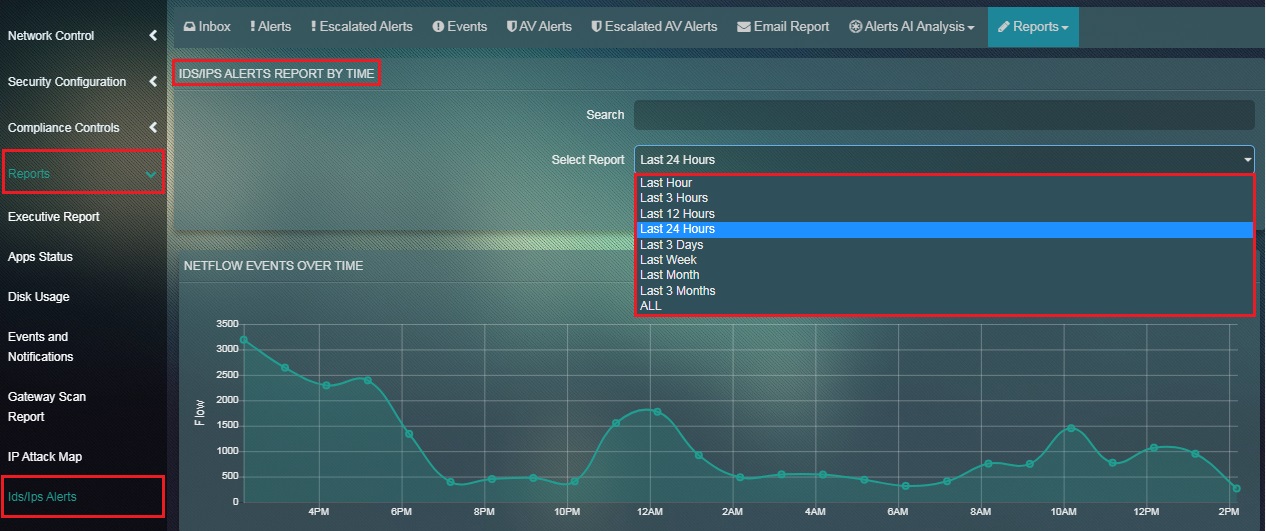
Note: The Flow report will automatically get filtered once the time range is selected.
How to Interpret the Data Mentioned in the Netflow Events Over Time Graph?
Step 1: In the Flow Report page, the Netflow Events Over Time Graph has time in the x axis and the number of netflow events in the y axis. 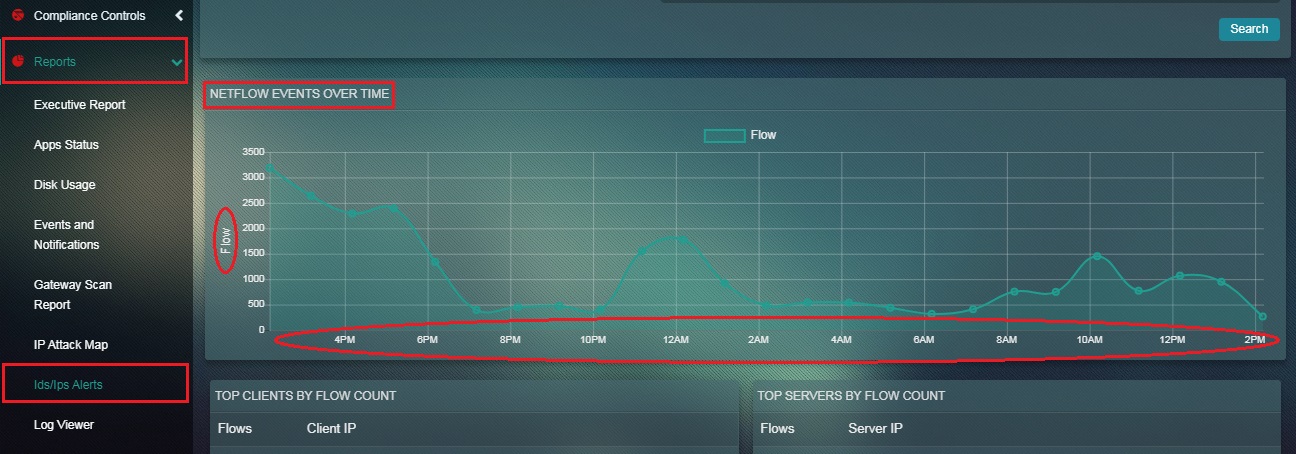
Note: The graph shows the number of Netflow Events recorded by the Crystal Eye appliance at a given point of time.
How to email the Flow Report to any email address of your choice?
Step 1: In the IDS/IPS Alerts application page, click the Reports dropdown button and select Flow.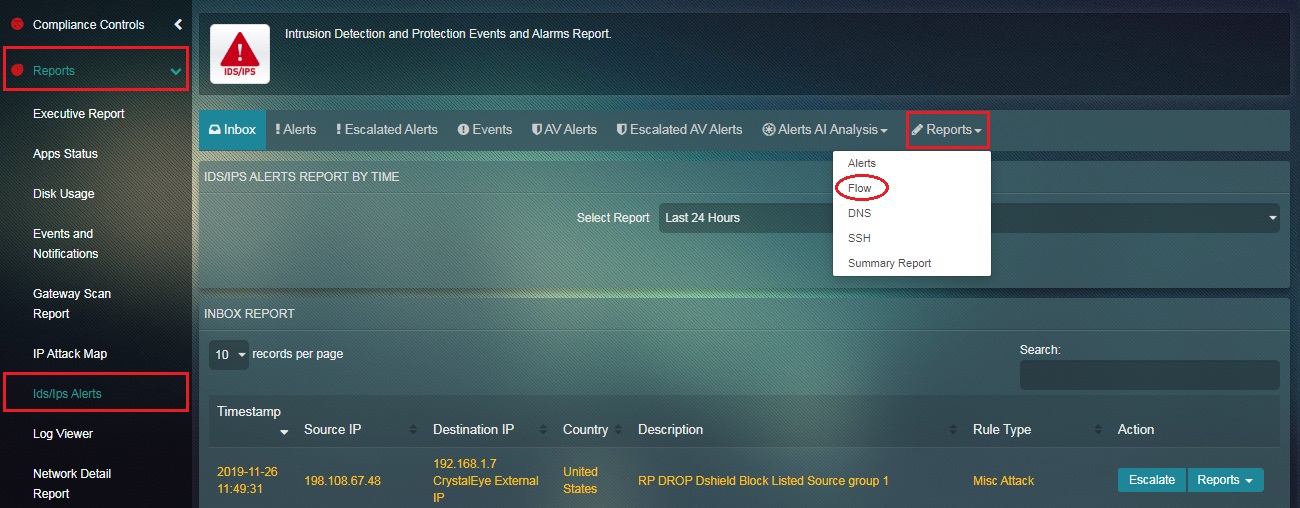
Step 2: You will now see the Flow Report page. Click the Email Report tab.
Step 3: You will now see an email pop-up. Enter the desired email address in the textbox and click the Send button.
The DNS Report primarily shows the number of DNS requests recorded by the Crystal Eye appliance over a particular period of time. The data can be filtered according to the desired time range and can be analysed under various categories such as Top Request RRNames, Top Response Rdata, Top DNS Servers, Top DNS Clients, Top Request Types, and Top Response Codes.
How to view DNS Report in the IDS/IPS Alerts application page?
Step 1: In the IDS/IPS Alerts page, click the Reports dropdown button and select DNS.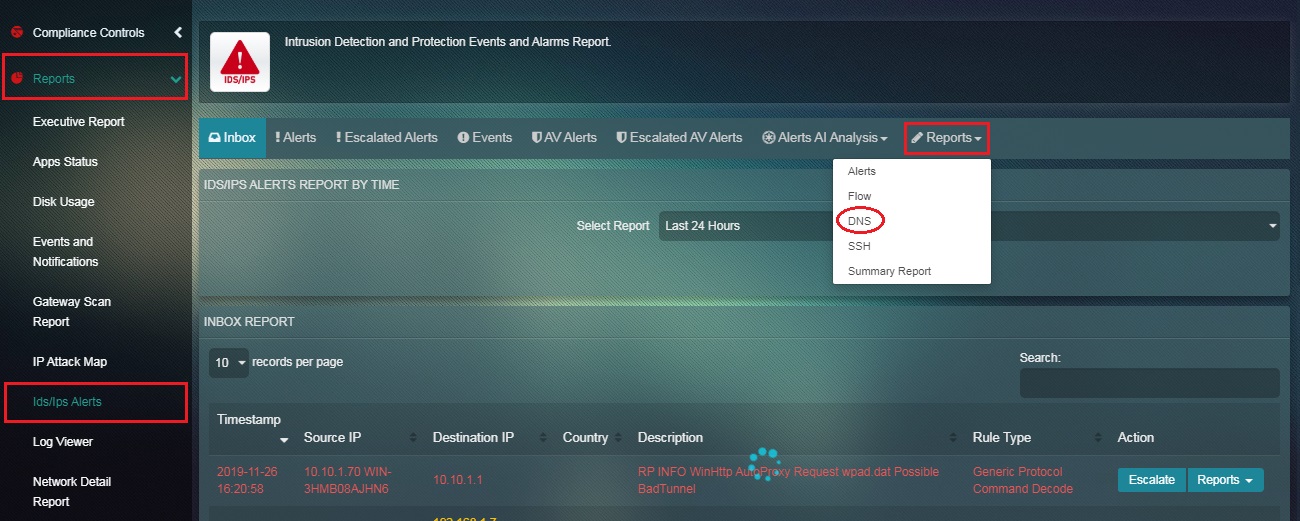
Step 2: You will now see the DNS Report page. 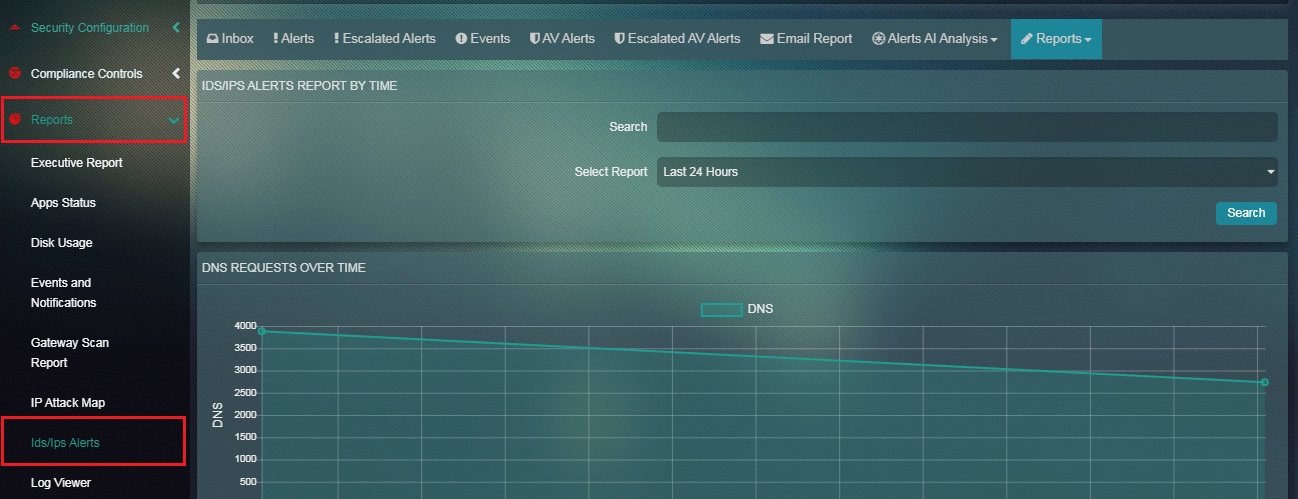
How to Filter the DNS Report according to a Particular Time Range?
Step 1: In the DNS Report page, click the time range dropdown under the IDS/IPS Alerts Report by Time section.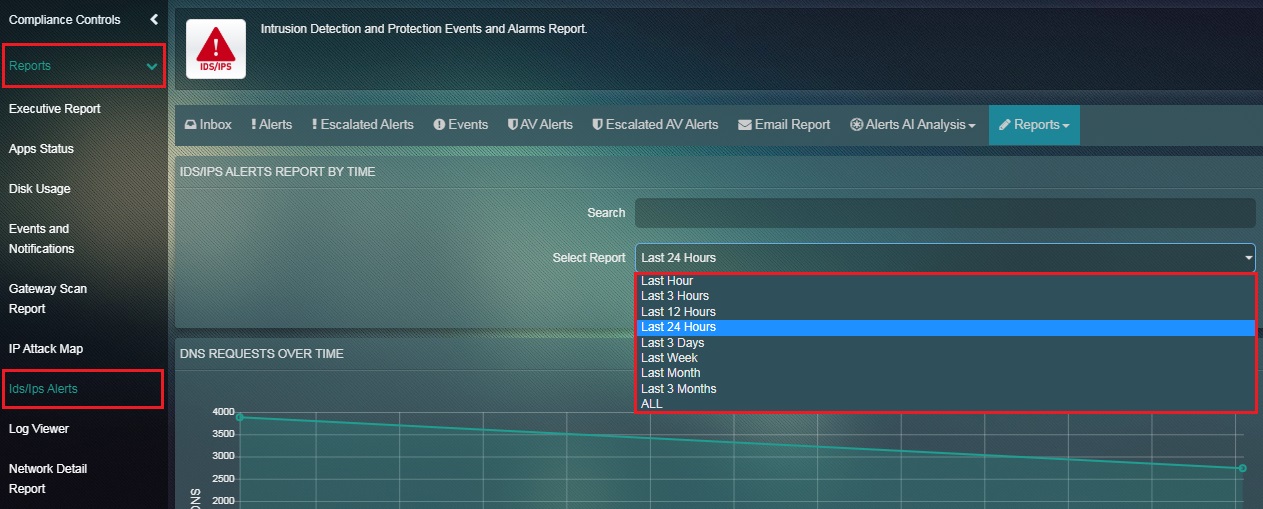
Note: The Flow report will automatically get filtered once the time range is selected.
How to Interpret the Data Mentioned in the DNS Requests Over Time Graph?
Step 1: In the DNS Report page, the DNS Requests Over Time Graph has time in the x axis and the number of DNS requests in the y axis.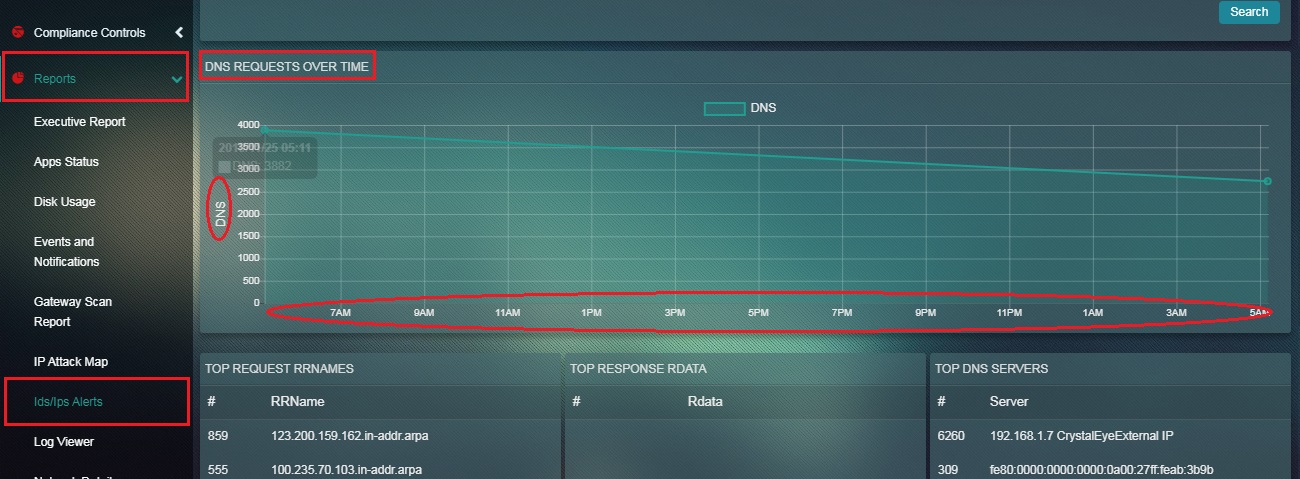
Note: The graph shows the number of DNS Events recorded by the Crystal Eye appliance at a given point of time.
How to email the DNS Report to any email address of your choice?
Step 1: In the IDS/IPS Alerts application page, click the Reports dropdown button and select DNS.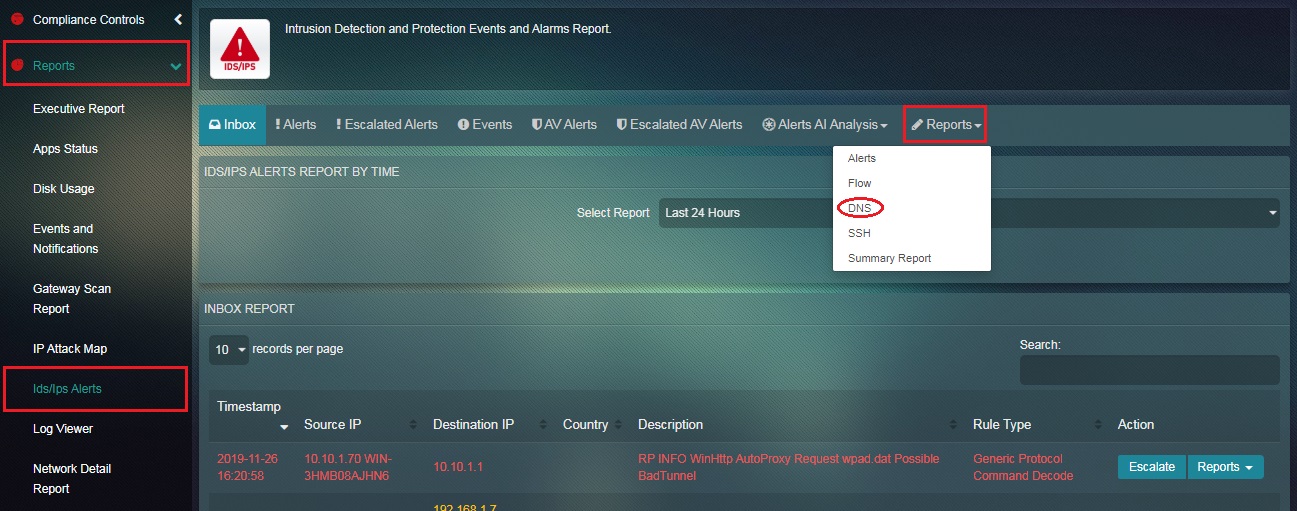
Step 2: You will now see the DNS Report page. Click the Email Report tab.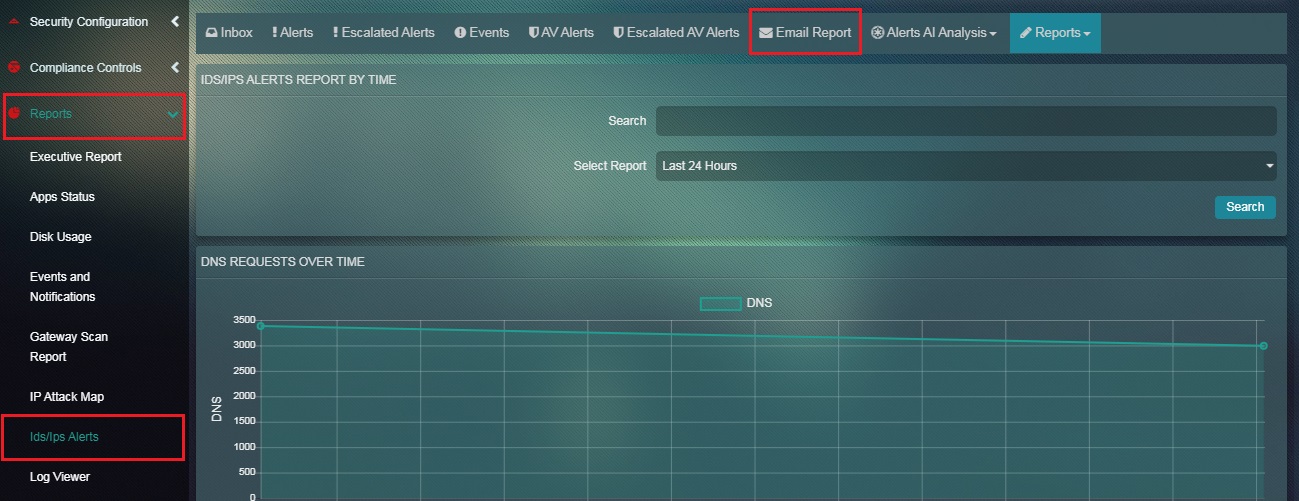
Step 3: You will now see the email pop-up. Enter the desired email address in the textbox and click the Send button.
The SSH Report shows the number of SSH connections made on the Crystal Eye network. A time range filter can be used to view the SSH connections related information for a specific period of time. The report also sheds light on various other SSH connections related parameters such as SSH Client Software, SSH Server Software, Top SSH Client Hosts, and Top SSH Server Hosts.
How to view SSH Report in the IDS/IPS application page?
Step 1: In the IDS/IPS Alerts page, click the Reports dropdown button and select SSH.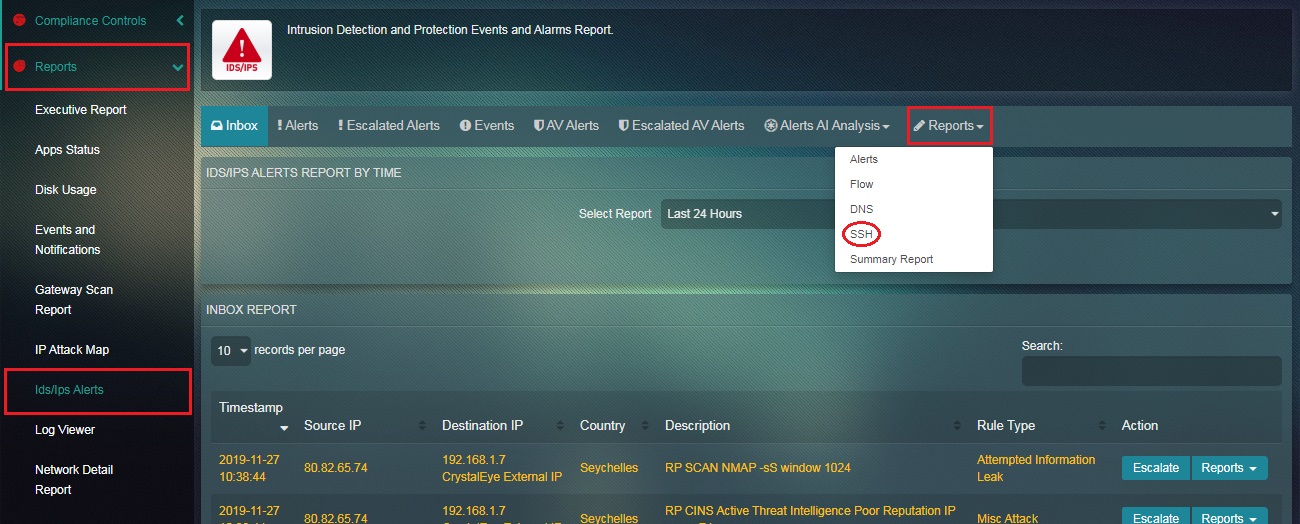
Step 2: You will now see the SSH Report page.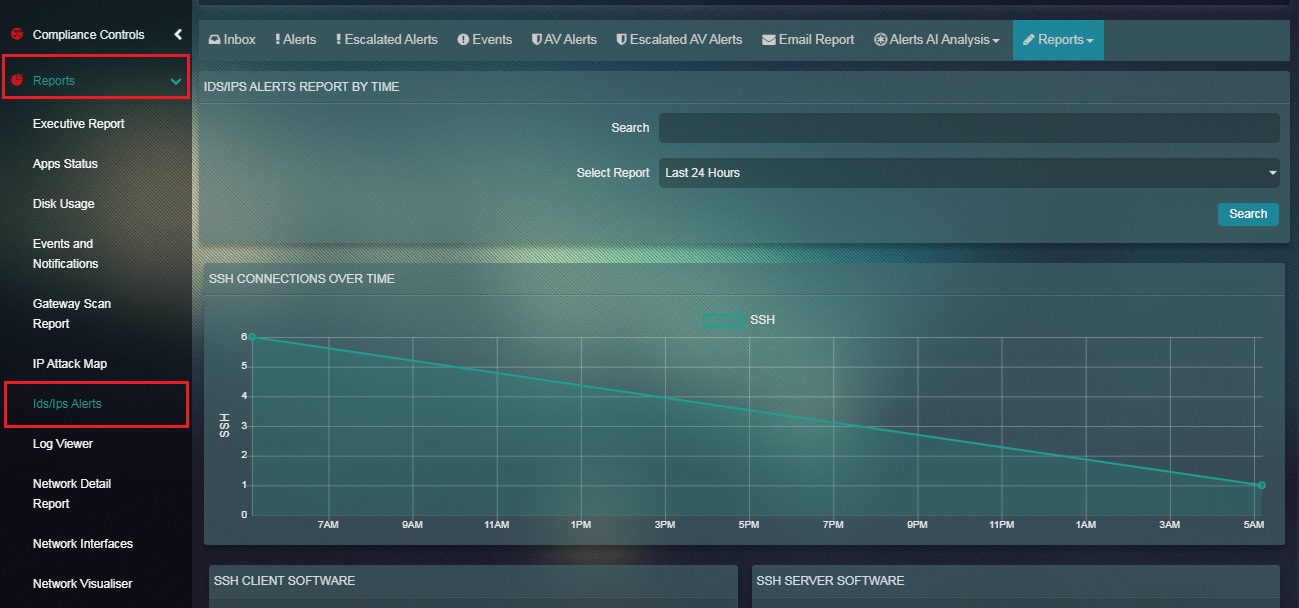
How to Filter the SSH Report according to a Particular Time Range?
Step 1: In the SSH Report page, click the time range dropdown under the IDS/IPS Alerts Report by Time section. 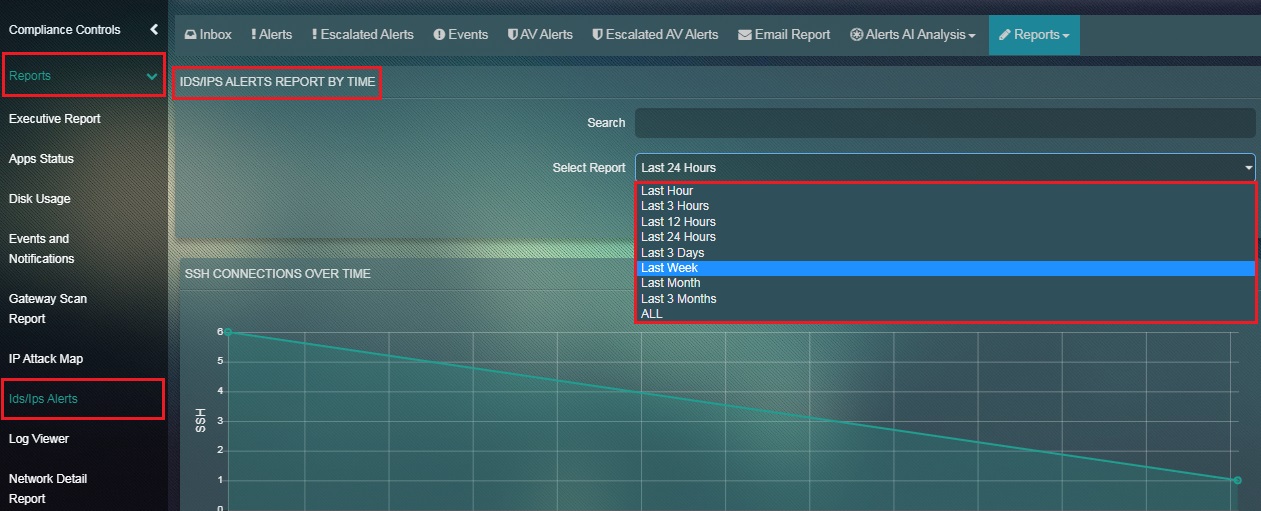
Note: The SSH report will automatically get filtered once the time range is selected.
How to Interpret the Data Mentioned in the SSH Connections Over Time Graph?
Step 1: In the SSH Report page, The SSH Connections Over Time Graph has time in the x axis and the number of SSH connections in the y axis.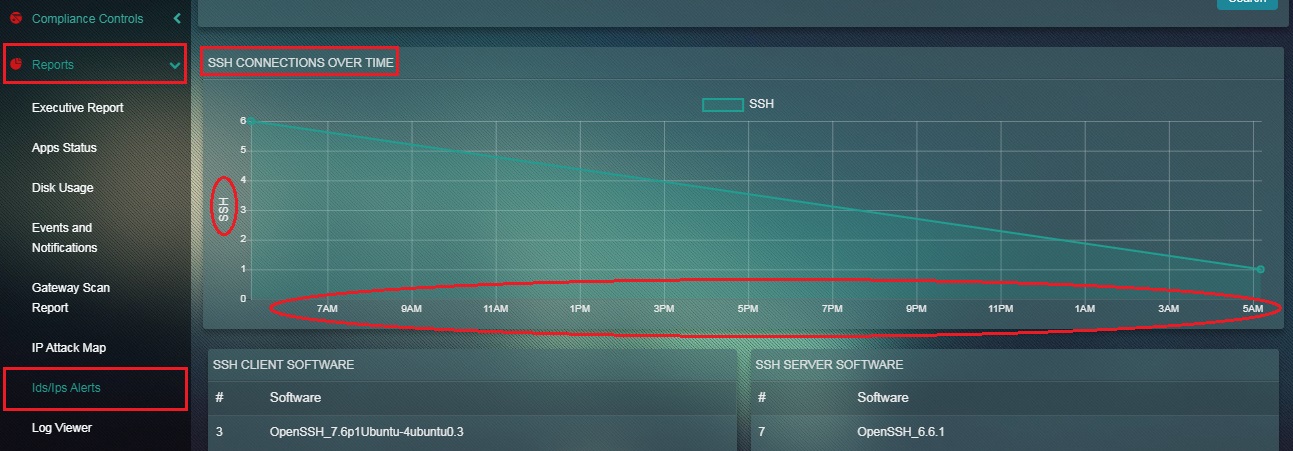
Note: The graph shows the number of SSH connections on the Crystal Eye network at a given period of time.
How to email the SSH Report to any email address of your choice?
Step 1: In the IDS/IPS Alerts application page, click the Reports dropdown button and select SSH.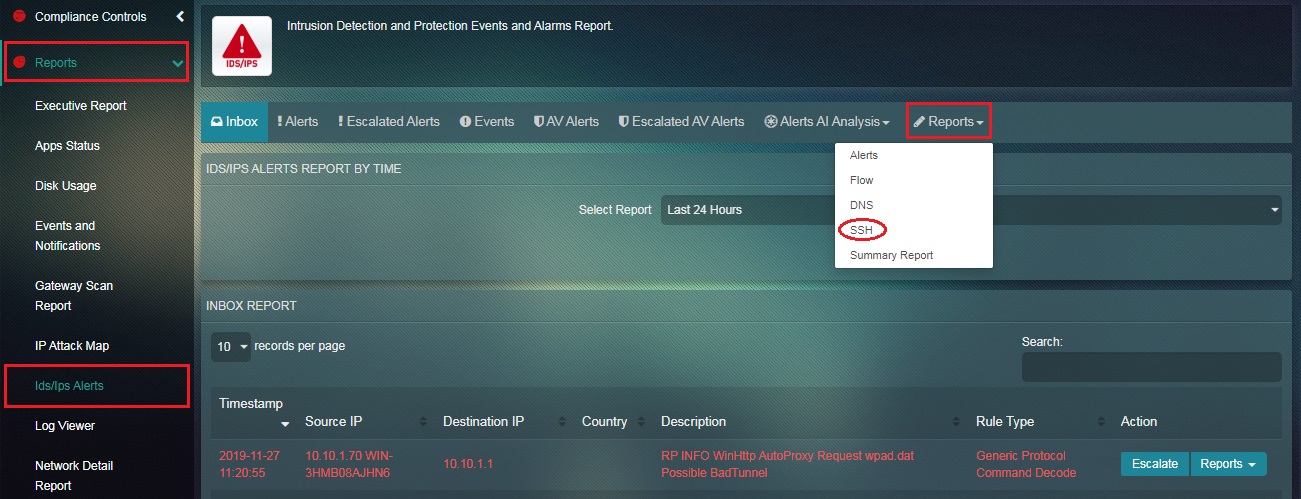
Step 2: You will now see the SSH Report page. Click the Email Report tab.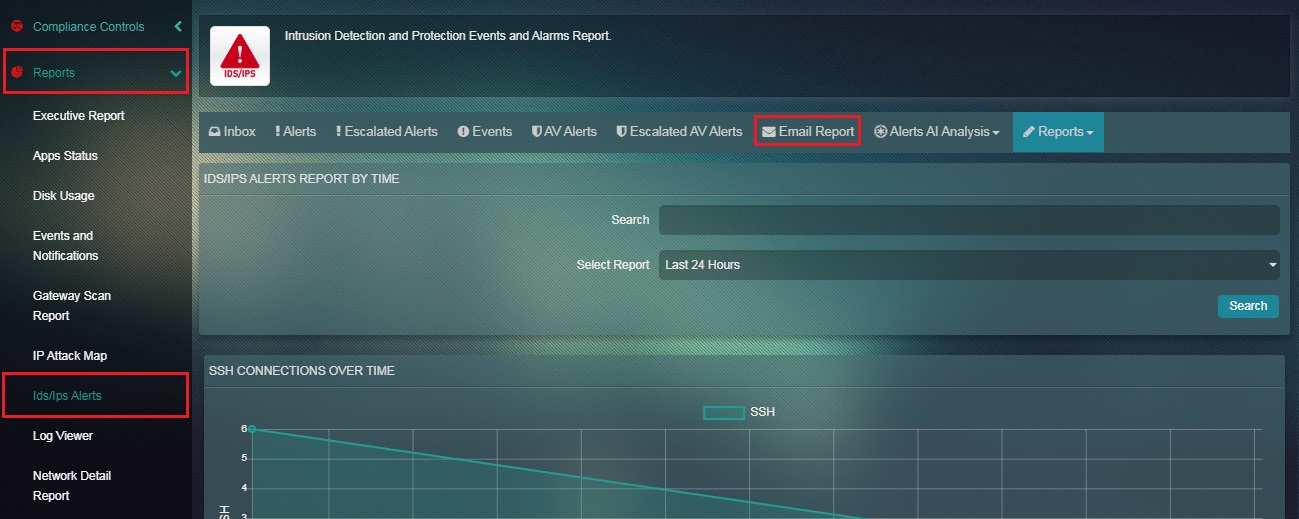
Step 3: You will now see the email pop-up. Enter the desired email address in the textbox and click the Send button.
Summary Reports of the IDS/IPS alerts application covers various parameters detected and recorded by the Crystal Eye appliance such as Alerts, Flow, DNS and SSH. The CE administrator can configure this feature to send reports periodically (Daily, Weekly or Monthly Basis). The report can be filtered according to the desired time range and can be sent to a particular email id.
How to schedule summary reports to be sent to a particular email address?
Step 1: In the IDS/IPS Alerts application page, click the Reports dropdown button and select Summary Report.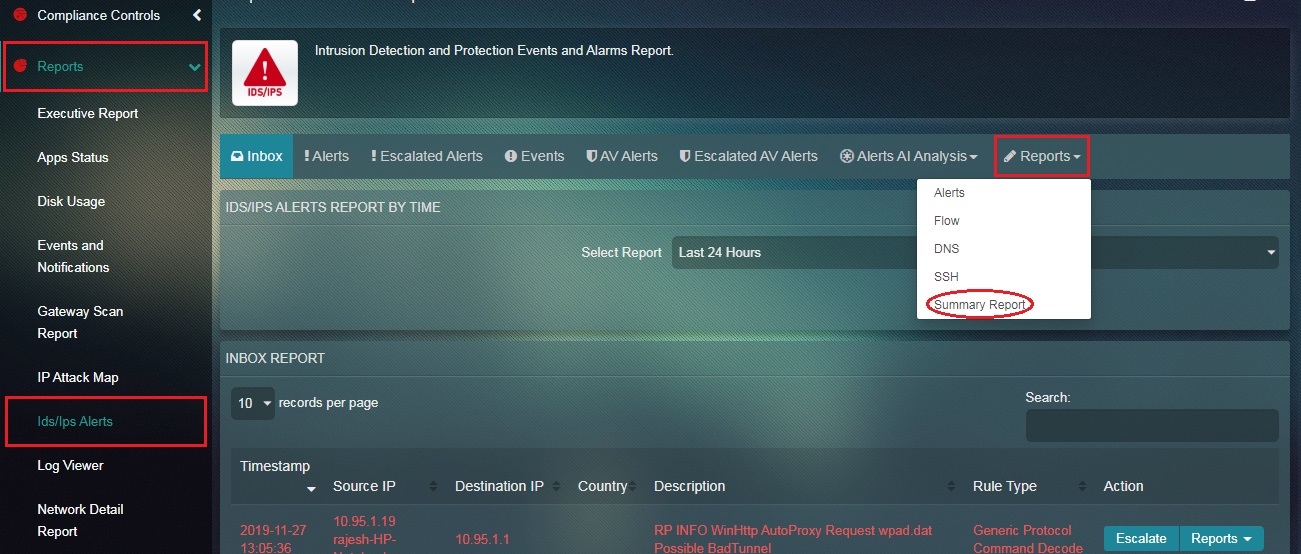
Step 2: You will now see the Summary Report page. Click the Add button. 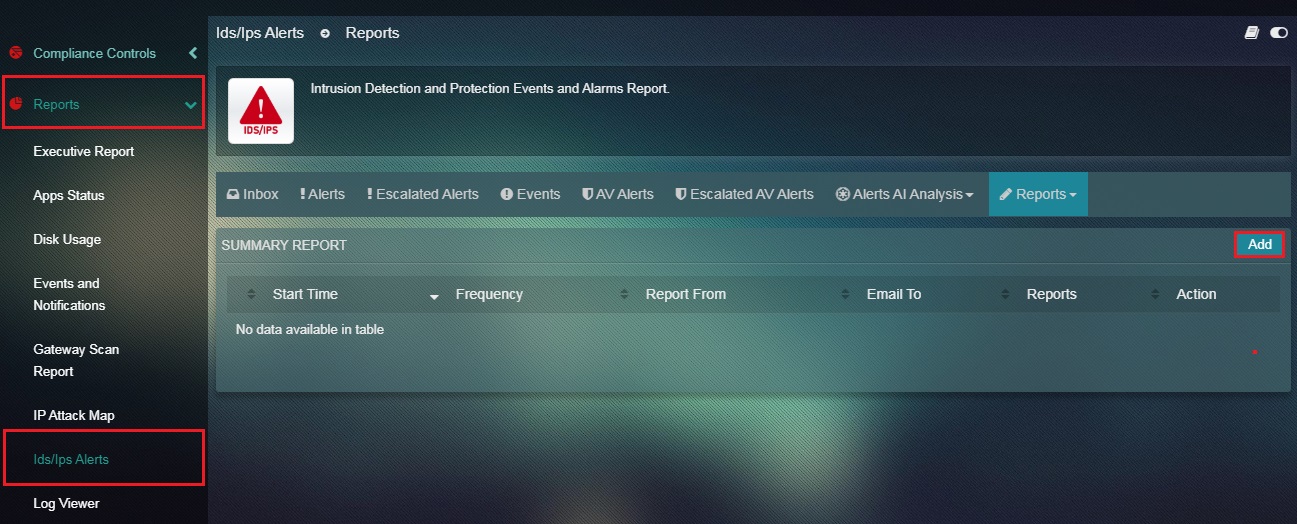
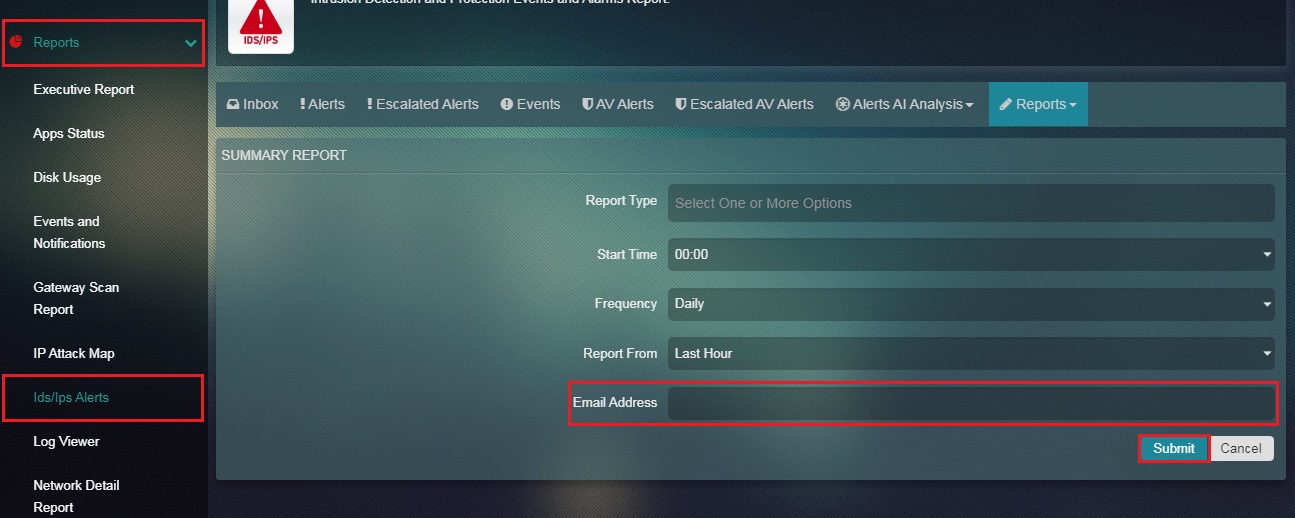
Step 3: You will now see the scheduling page of the Summary Report. Select the Report Type from the dropdown.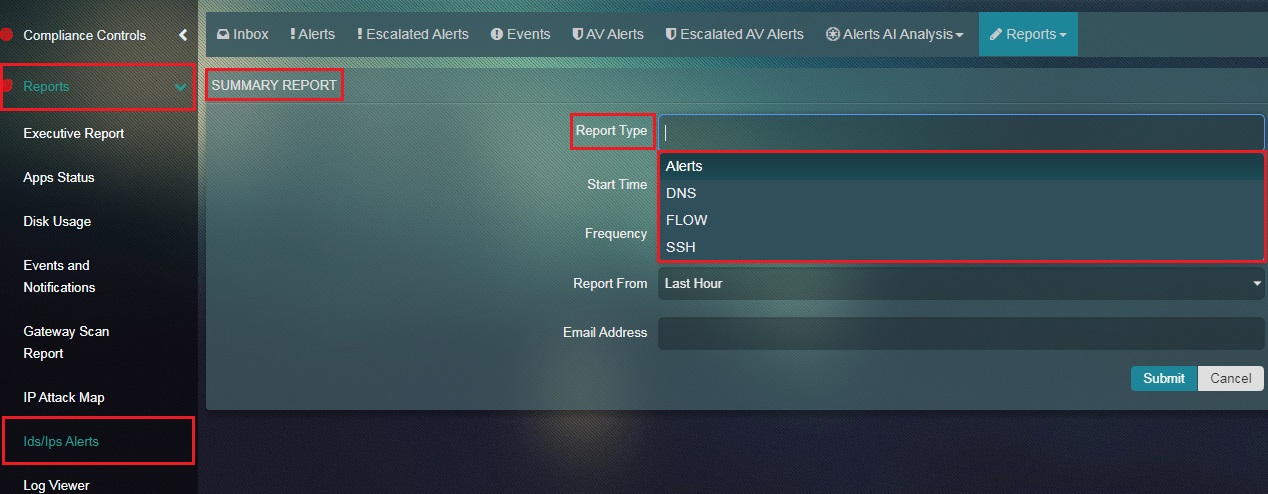
Note: Four types of reports can be selected namely, Alerts, DNS, Flow, and SSH.
Step 4: Select the Time at which the report is to be sent from the dropdown.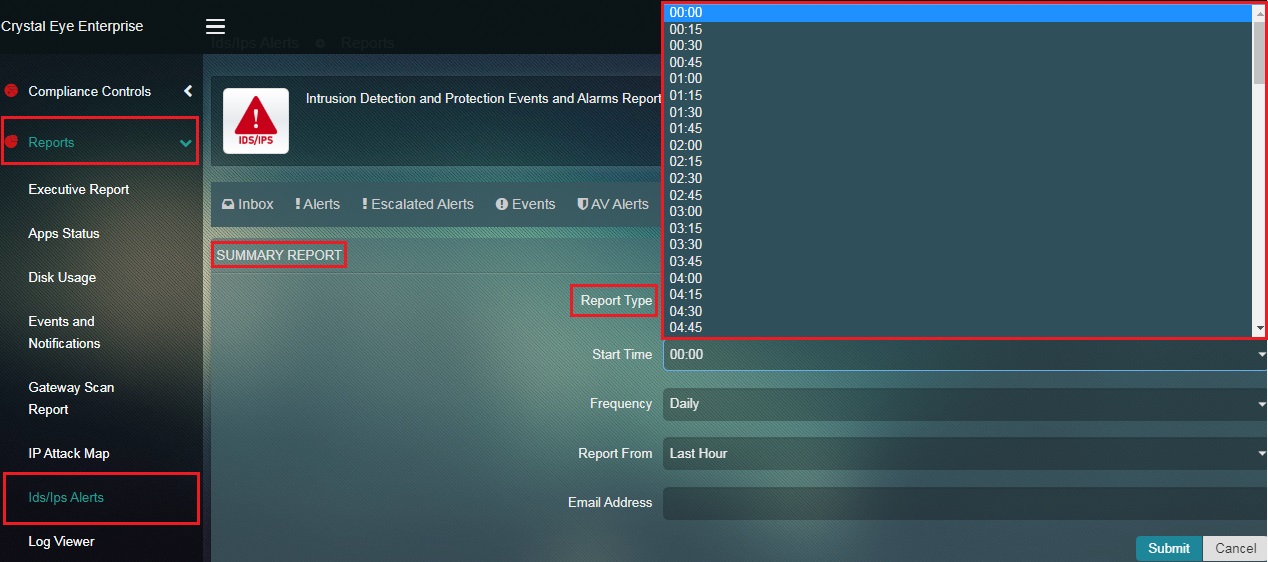
Step 5: Select the Frequency at which the report is planned to be sent.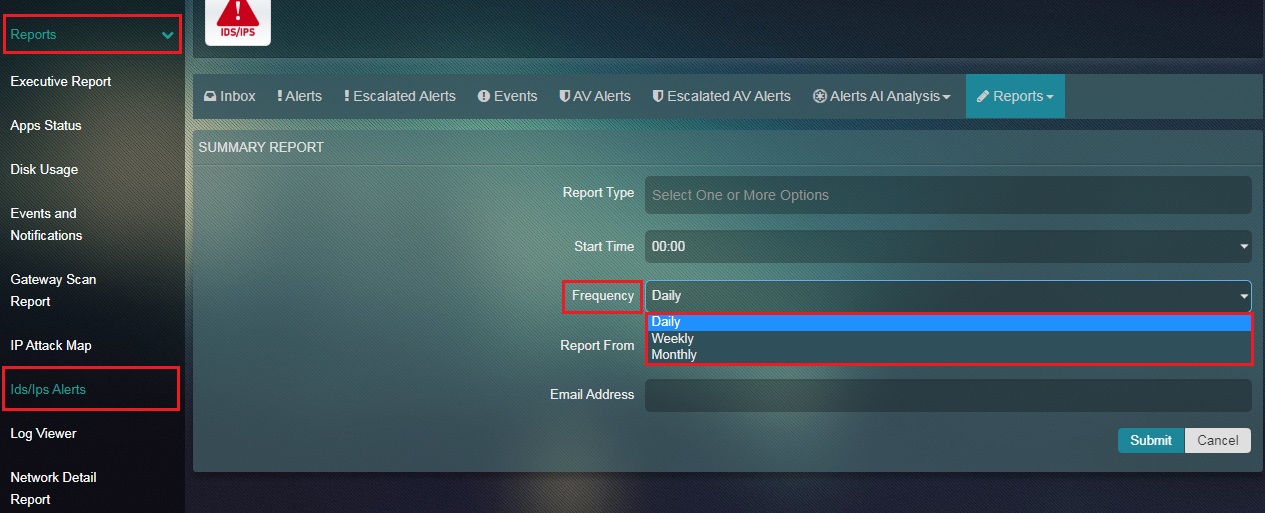
Step 6: Select the time range for which the report needs to be filtered.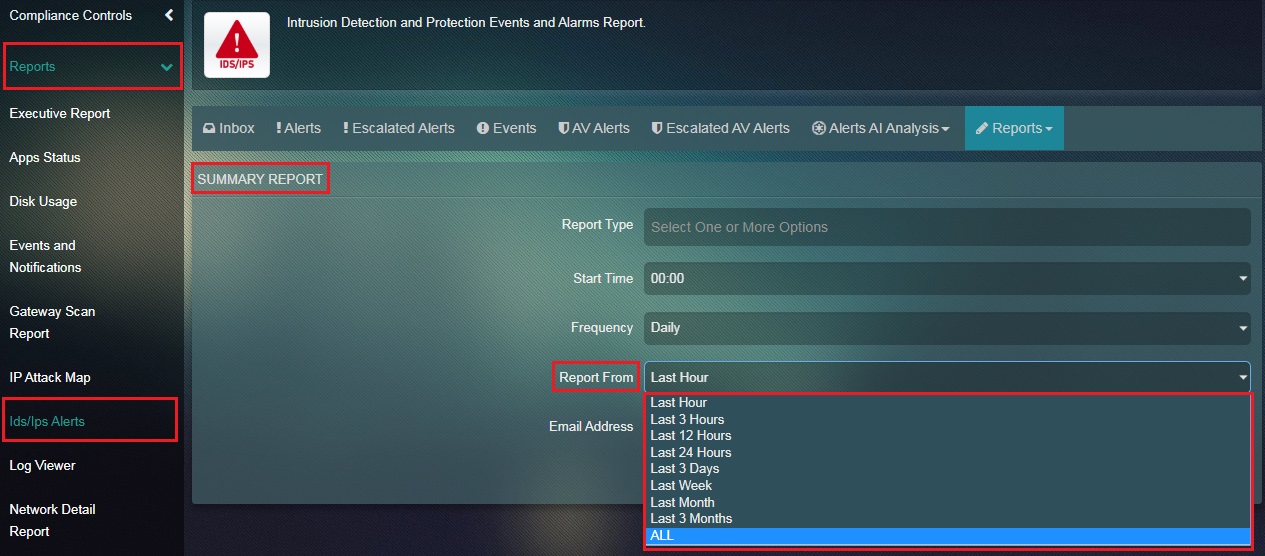
Step 7: Enter the Email Address to which the Summary Report needs to be sent to and click the Submit button.